✅ – Nesho – 10-41 Feb 25
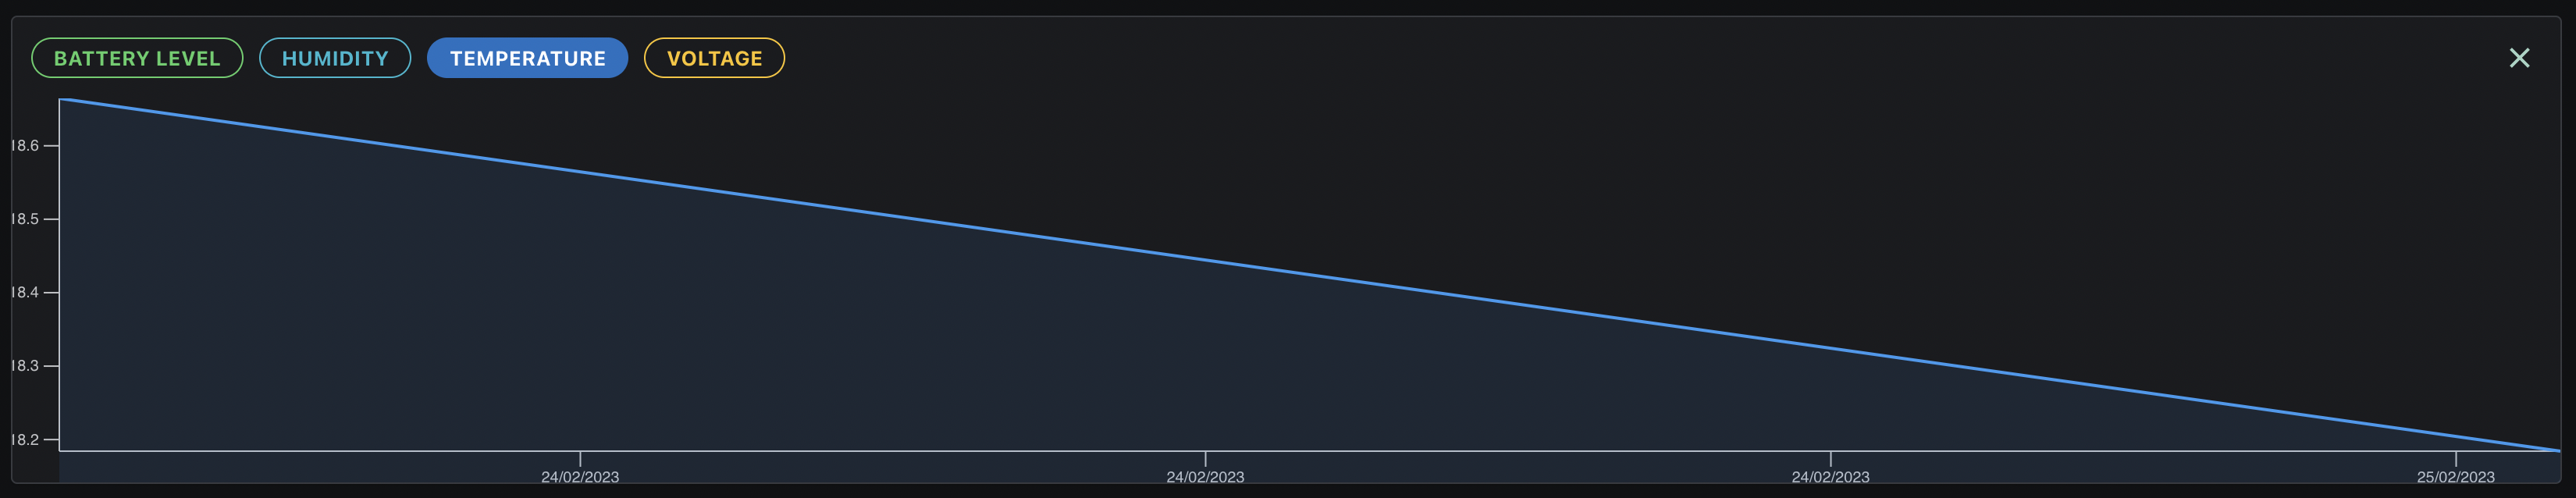
Hello, I'm using d3 to render charts. I have a problem with generating an area with
d3.area, the area is being generated outside of my svg size, even though I'm giving the y-scale the same size as my svg. Any ideas?
N
Nesho•439d ago
The area component
N
Nesho•439d ago
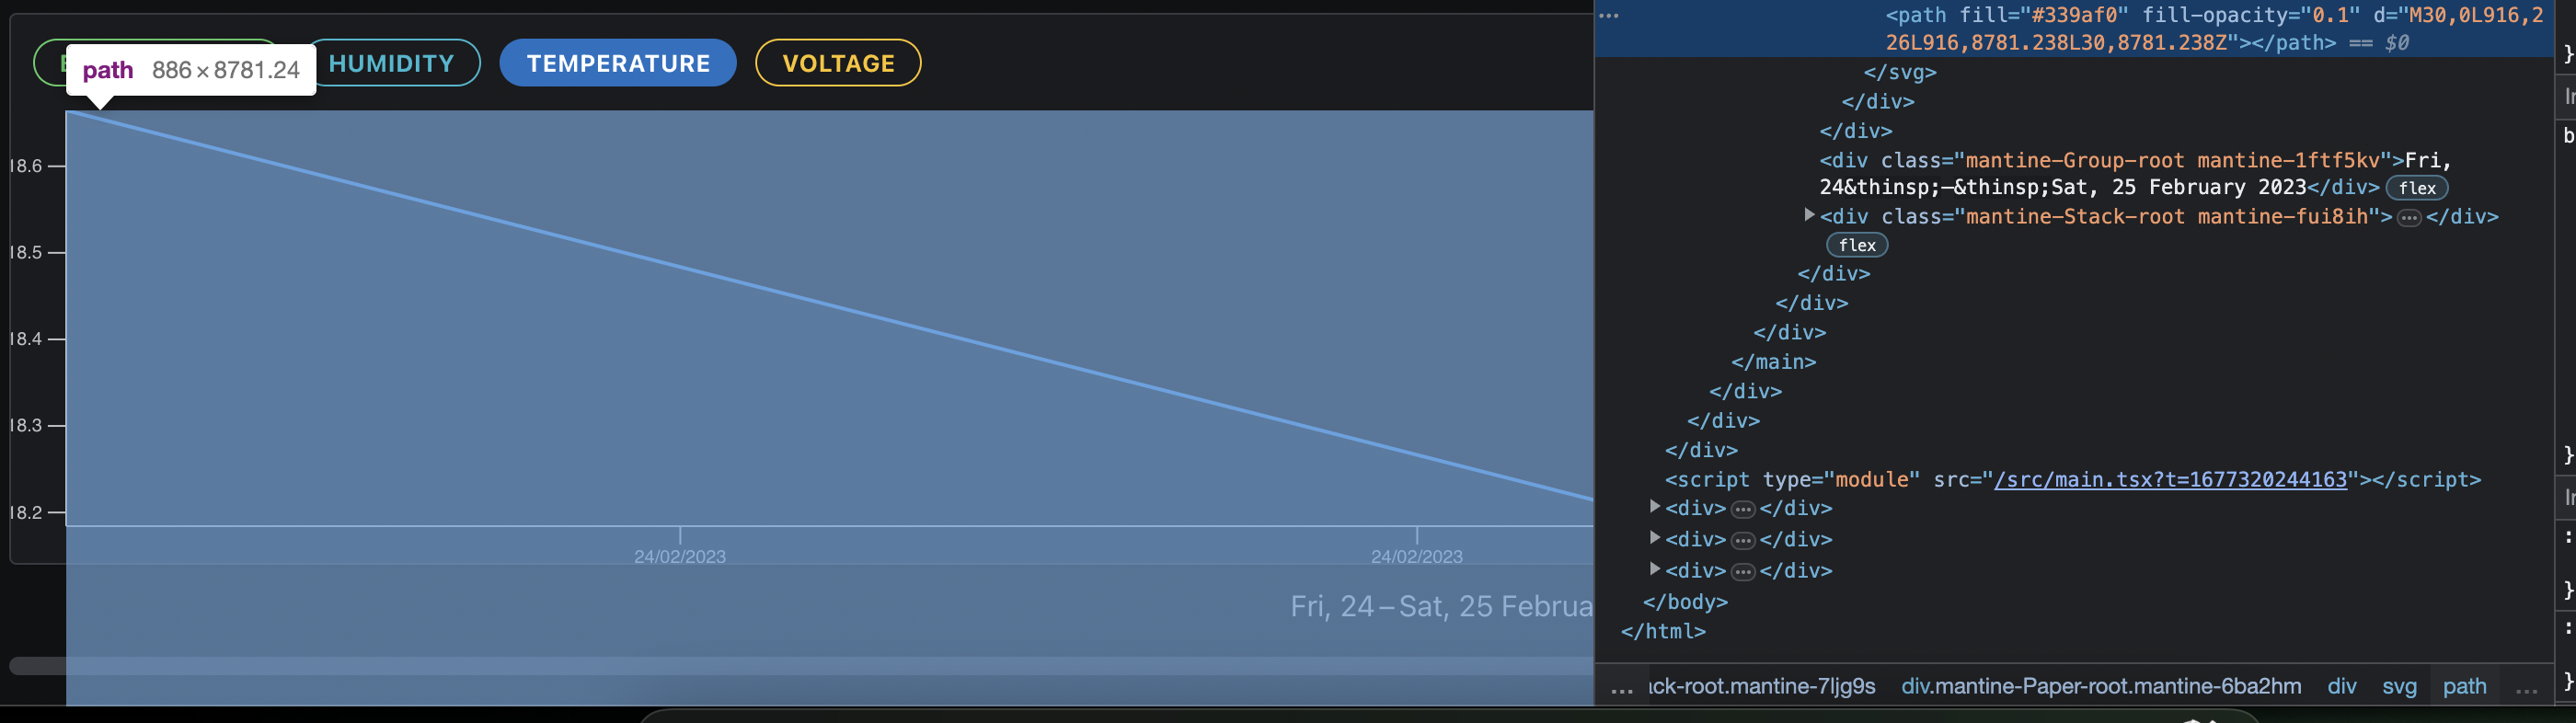
Result, as you can see, the height of the area is 8781, when it should be 226 (the height of the svg)
N
Nesho•439d ago
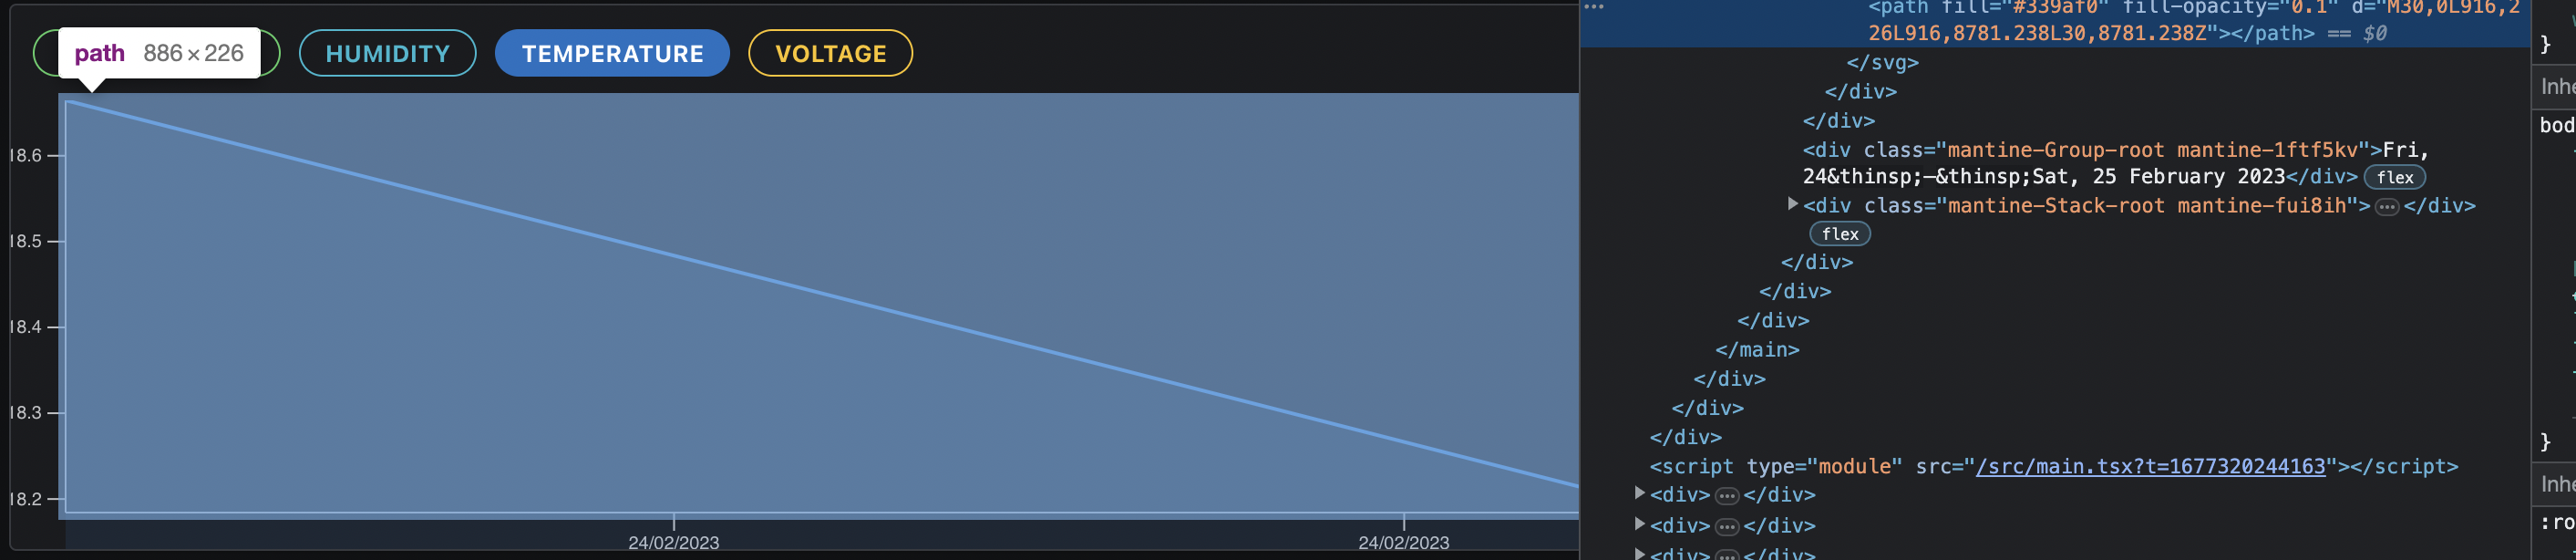
The line above, using the same scales
N
Nesho•439d ago
Logging the range gives me
[226, 0], which is correct.
Solved it. The issue was that I was doing .domain(d3.extent(data, (d) => d[yKey])) in the yScale, when I needed to give it a minimum value of 0 ,and just find the max value .domain([0, d3.max(data, (d) => d[yKey])]).
The area calculates and plots correctly now.UU
Unknown User•438d ago
230KMembers
View on DiscordMore Posts
Set.prototype.has() returns false even when element is presentI learning React.js, and would like to implement filter functionality based on the checkboxes selectHalcyonXII – 20-45 Feb 23why is this giving me error handleCat is not a function⛄Snowberb⛄ – 09-16 Feb 23How could I force an api error from a production side? What I mean is to do it not from `http://locaHalcyonXII – 16-29 Feb 18