❔ WPF/GDI+/NativeWindow - fps caps when detaching debugger
Hey, I have a strange issue with the visual studio debugger related to the refresh rate. (net framework 4.8.1 + WPF and GDI+ with a NativeWindow)
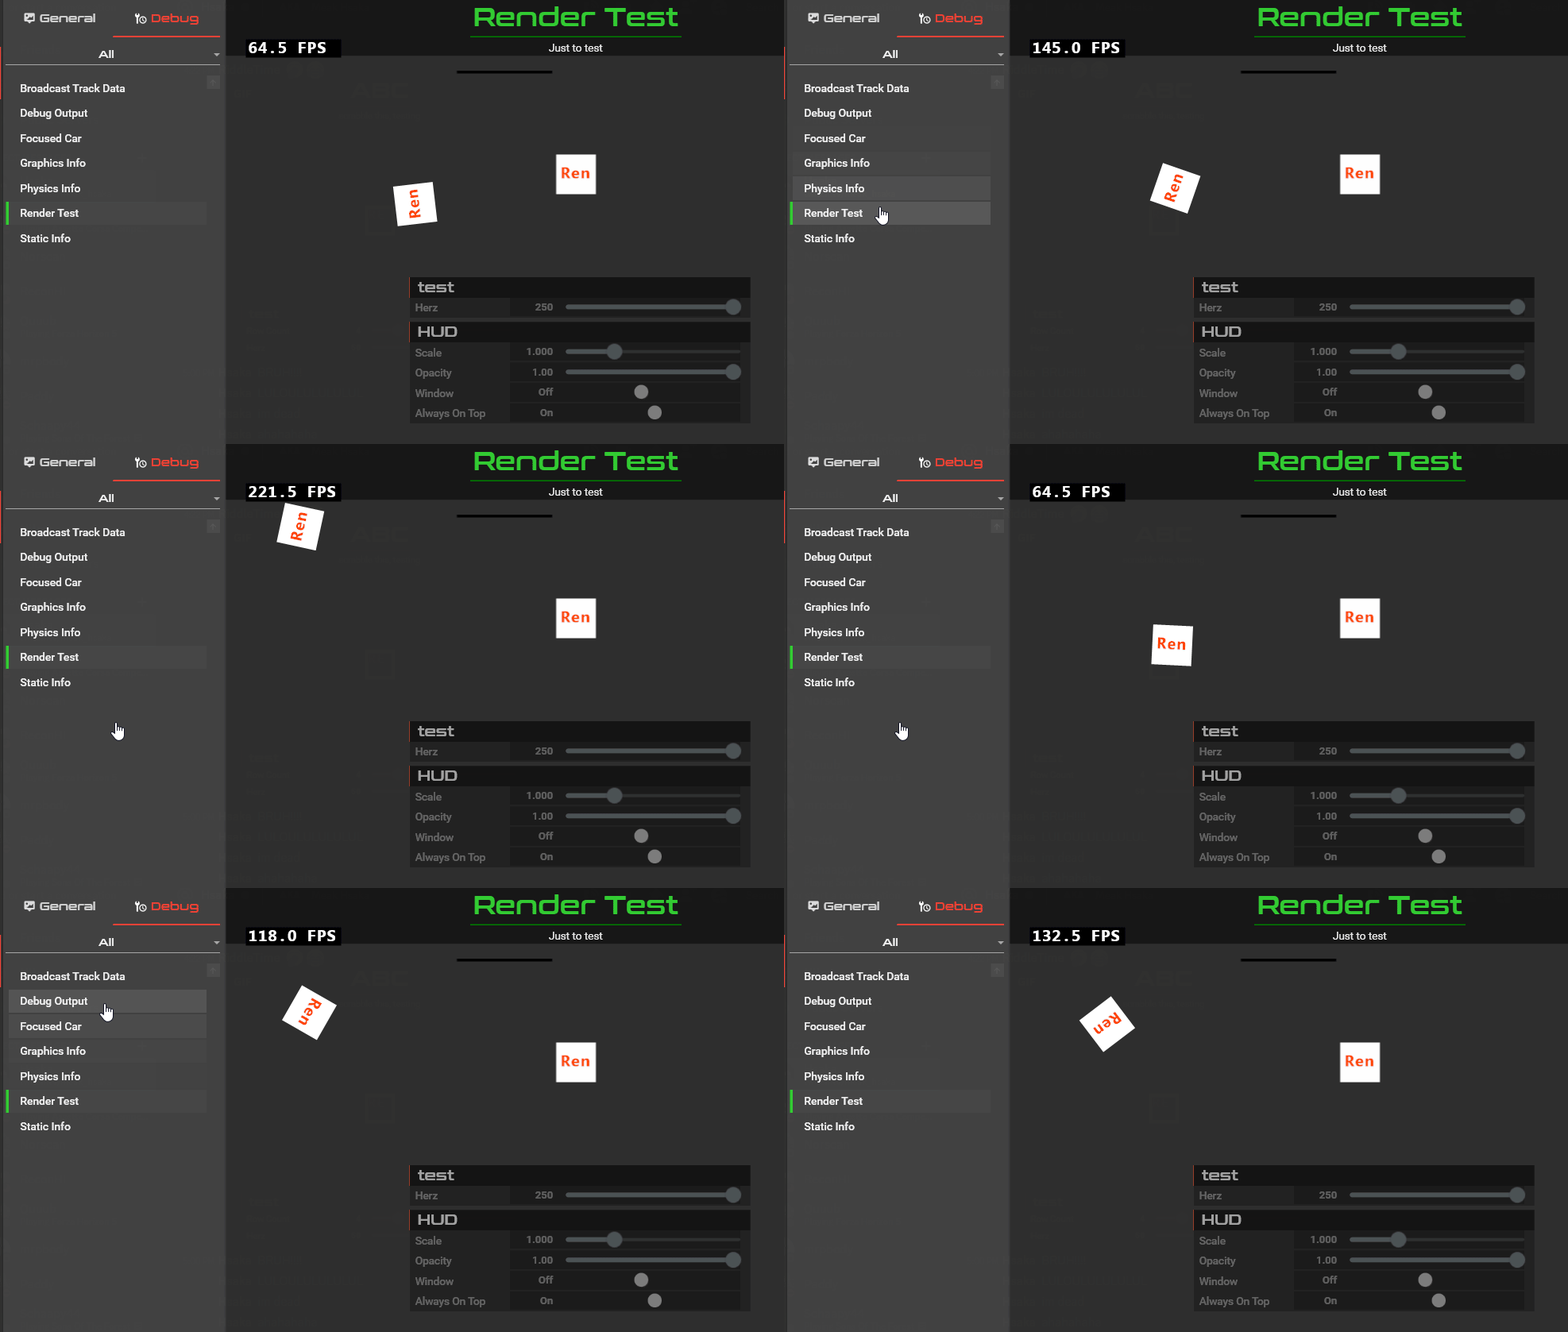
As soon as I attach the debugger the framerate goes up to what I set the target to be. It is independent of either Debug or Release builds. When detaching the debugger the framerate drops again.
Without the debugger attached the framerate will also go up when hovering certain WPF gui elements.
I am pretty clueless why attaching the debugger has an effect here or why hovering gui elements do as well.
Is there something I should know about WPF and could this have anything to do with the Windows Desktop Manager?
(the gif below shows the issue whilst hovering the WPF GUI, the native(transparent) window is shown on the right side.)
https://github.com/RiddleTime/Race-Element

GitHub
Provides Solutions for Sim Racing. Contribute to RiddleTime/Race-Element development by creating an account on GitHub.

