Understanding daily data storage
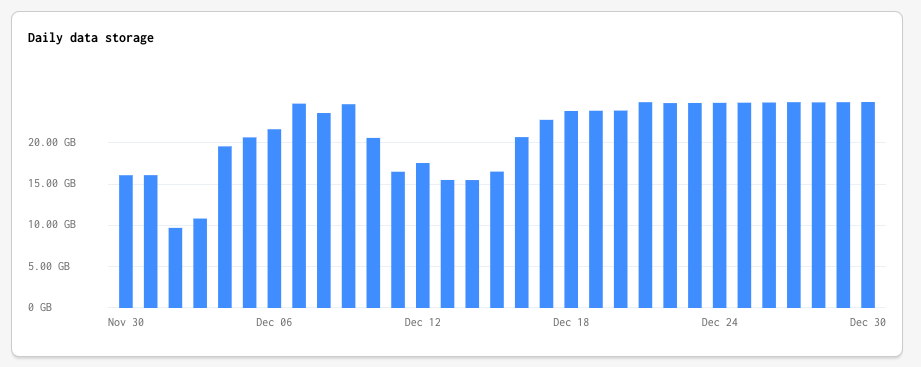
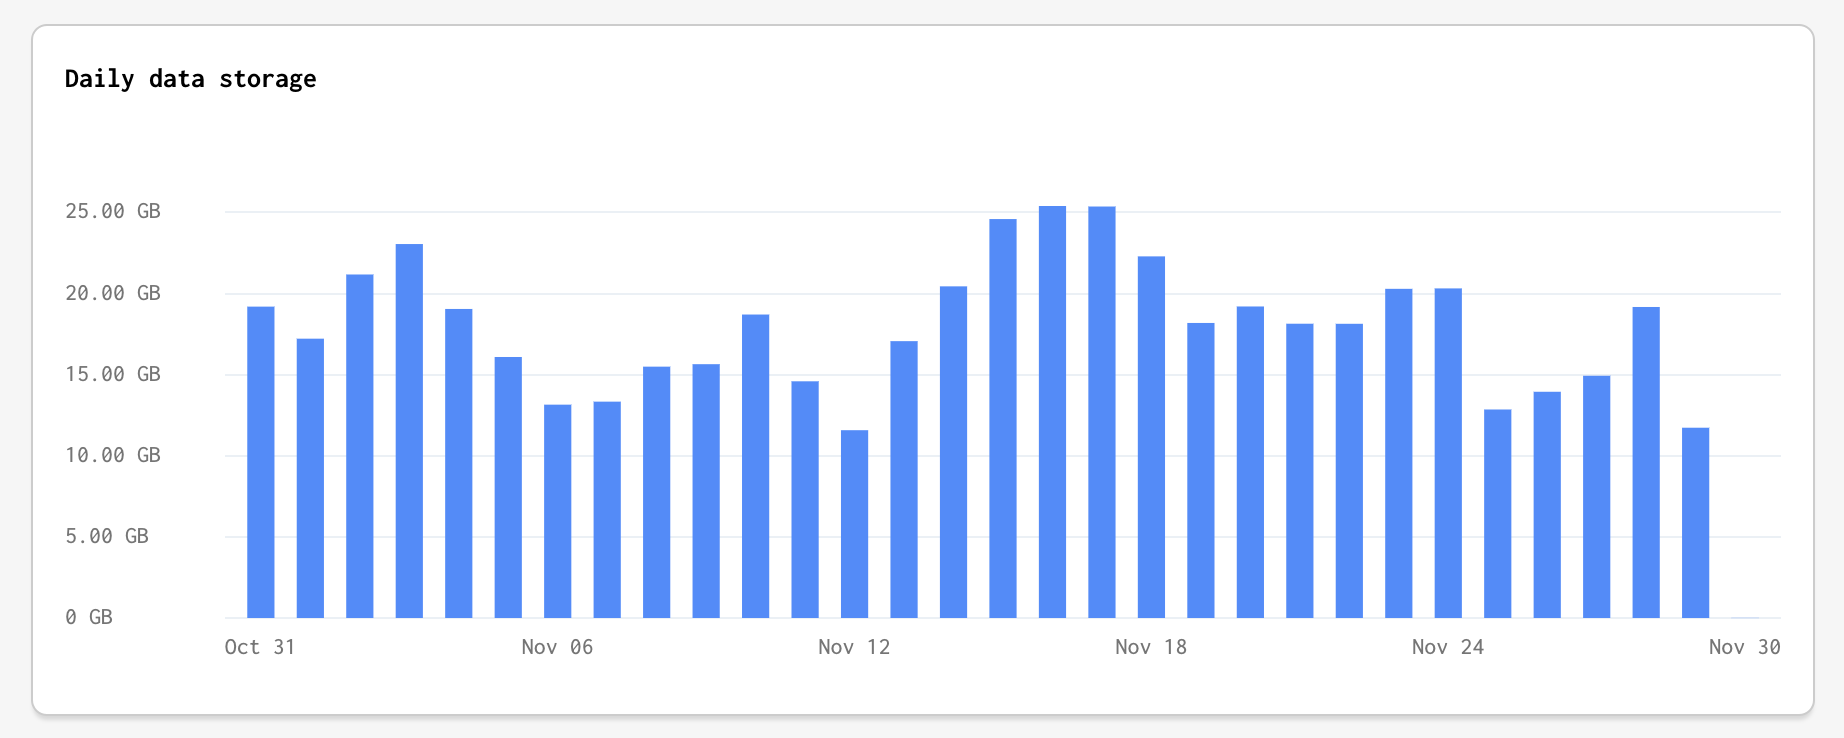
Why is my daily data storage fluctuating so much? Doesn't it reflect the data stored at that day and shouldn't it therefor be pretty stable, slowly creeping up over time (like the last days of December?)
E.g. I'm curious to understand what happened e.g. on Dec 2 or Dec 3? Or caused fluctuations throughout November?
Also, on December 5, I deployed an update that removed many model fields:
- 25 (out of 73) fields from shopifyOrder
- 11 (out of 30) fields on shopifyOrderLineItem
- A few fields on other models, e.g. the body field on shopifyProduct and shopifyCollection, which contains the often large htmlBody of product description or collection description
Now my expectation would have been for above graph to drop on dec 5 and 6. It instead went up further and dropped a few days later - is that because of backups you keep or why could that be?
As background:
- App is elitecart
- Running one major app. Never, other than when I deleted the fields as described above, did we delete any large amount of data. Even if apps would uninstall, we don't remove their data.