Draw polygons on a Livecharts2 chart
I'm trying to figure out how to draw custom polygons on a chart using livecharts, but the documentation I'm seeing on their site does not match the latest releases. For instance, https://livecharts.dev/docs/eto/2.0.0-rc2/samples.general.drawOnCanvas these functions don't work or are marked obsolete.
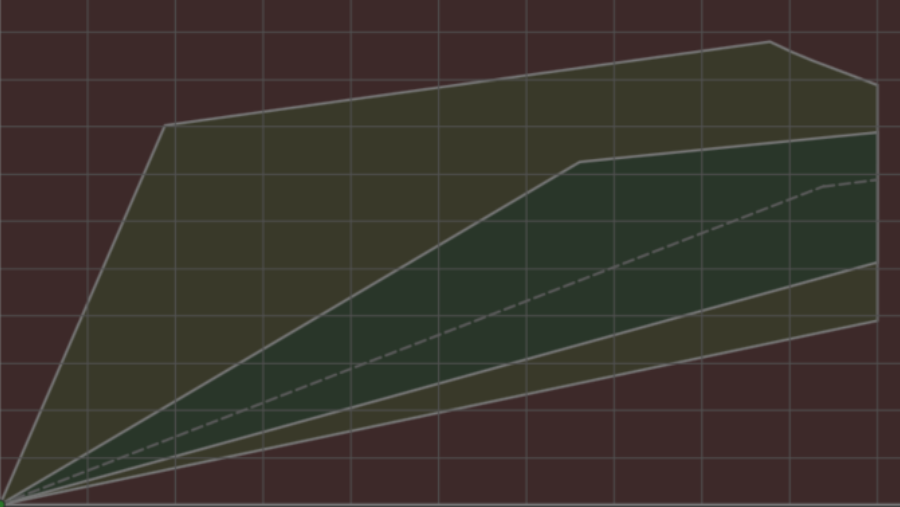
Basically, I want to define 2 areas/polygons using a list of points and these polygons should be drawn on the chart and resize/move accordingly when the chart zooms/pans.
There will be a static min/max x and y for the chart. The polygons themselves could be redrawn with a different set of points, but won't be constantly updated or anything like that. Attached image for what I'm going for.