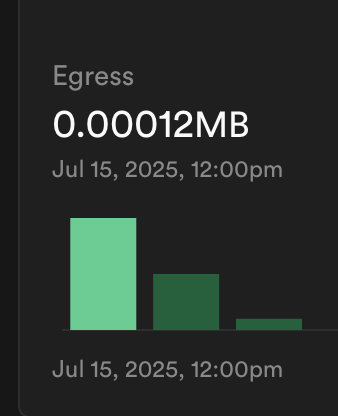
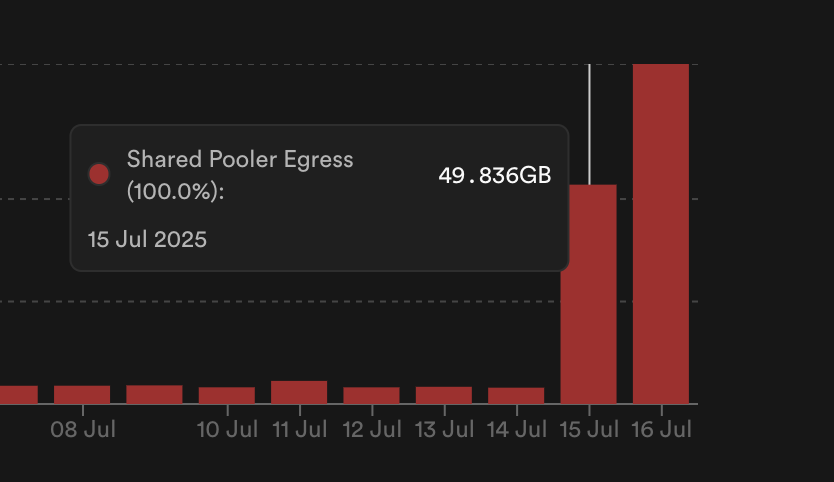
Egress Limit

Our egress has suddenly crossed the limit of 250 GB by 20 GBs. However, we don't make this many queries ever and our data is very small. Also, the data in the reports differ from the data in the usage panel. What are we doing wrong and what do we have to do to fix it?
No description
No description
15 Replies
Yannick
YannickOP4mo ago
Could it be a mistake by Supabase?
garyaustin
garyaustin4mo ago
What are you seeing in the organization usage tab for egress?
No description
garyaustin
garyaustin4mo ago
If your shared pooler egress sky rocketed on the 15th what might have changed using your db pooler connections? Looking at the query report for most frequent (database tab) might give you a clue.
Yannick
YannickOP4mo ago
No description
garyaustin
garyaustin4mo ago
You are only using the db pooler and not the REST API or storage?
Yannick
YannickOP4mo ago
We use direct connection mode to connect to the database. I have only experimented with transaction pooling so far on our development database, and this is our production db
No description
Yannick
YannickOP4mo ago
Pretty much, yes So far we mainly use Supabase to host a postgres database that our Spring Boot backend can connect to, so I don't see how this usage could ever occur
garyaustin
garyaustin4mo ago
See if there is a high running query in the query report. Under Reports Database there is some info on number of connections to the DB. Not sure how useful knowing that is. There is no log of queries thru the database ports.
Yannick
YannickOP4mo ago
We have some queries that need optimization but nothing that should be this extreme — this couldn’t be a mistake from supabase? Like I said, in the reports tab the egress usage isn’t that high at all for the mentioned dates
garyaustin
garyaustin4mo ago
Your not looking at the API egress report are you? That would not include the database direct access. It is for the REST API calls including the dashboard.
garyaustin
garyaustin4mo ago
So no queries with millions of requests here? Could anyone have your database password?
No description
garyaustin
garyaustin4mo ago
Something seems to have changed for you 2 days ago?
Did you role out a new feature? Change what ever code is calling the database? Add a new tool that syncs the database? You could also look at the database reports and see if any of those metrics spiked 2 days ago.
Yannick
YannickOP4mo ago
Not necessarily something that should have changed this, but it also only happened for two days Anywhere I can find a more extensive report on direct database access? I did find two that are extreme amounts, but I don't know in what kind of time period this happend (query performance tab)
garyaustin
garyaustin4mo ago
There is no way to go back and see with the current log settings unless there were errors. There are ways to get more info in the future... https://supabase.com/docs/guides/telemetry/logs?queryGroups=product&product=postgres#logging-postgres-queries I would look at the two extremes if they are your queries.
Yannick
YannickOP4mo ago
I think those two extremes were the culprit due to a OneToOne association being incorrectly set up -- how it just started causing trouble now I don't know, but I hope this update will solve the problems. Thank you for your help in this matter @garyaustin !

Did you find this page helpful?