Egress Usage
Hey everyone,
I'm seeing something weird on my Supabase usage dashboard and wanted to see if anyone else is experiencing the same thing.
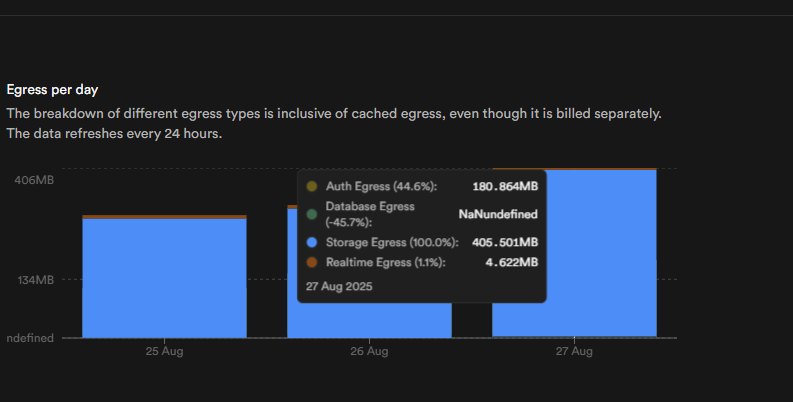
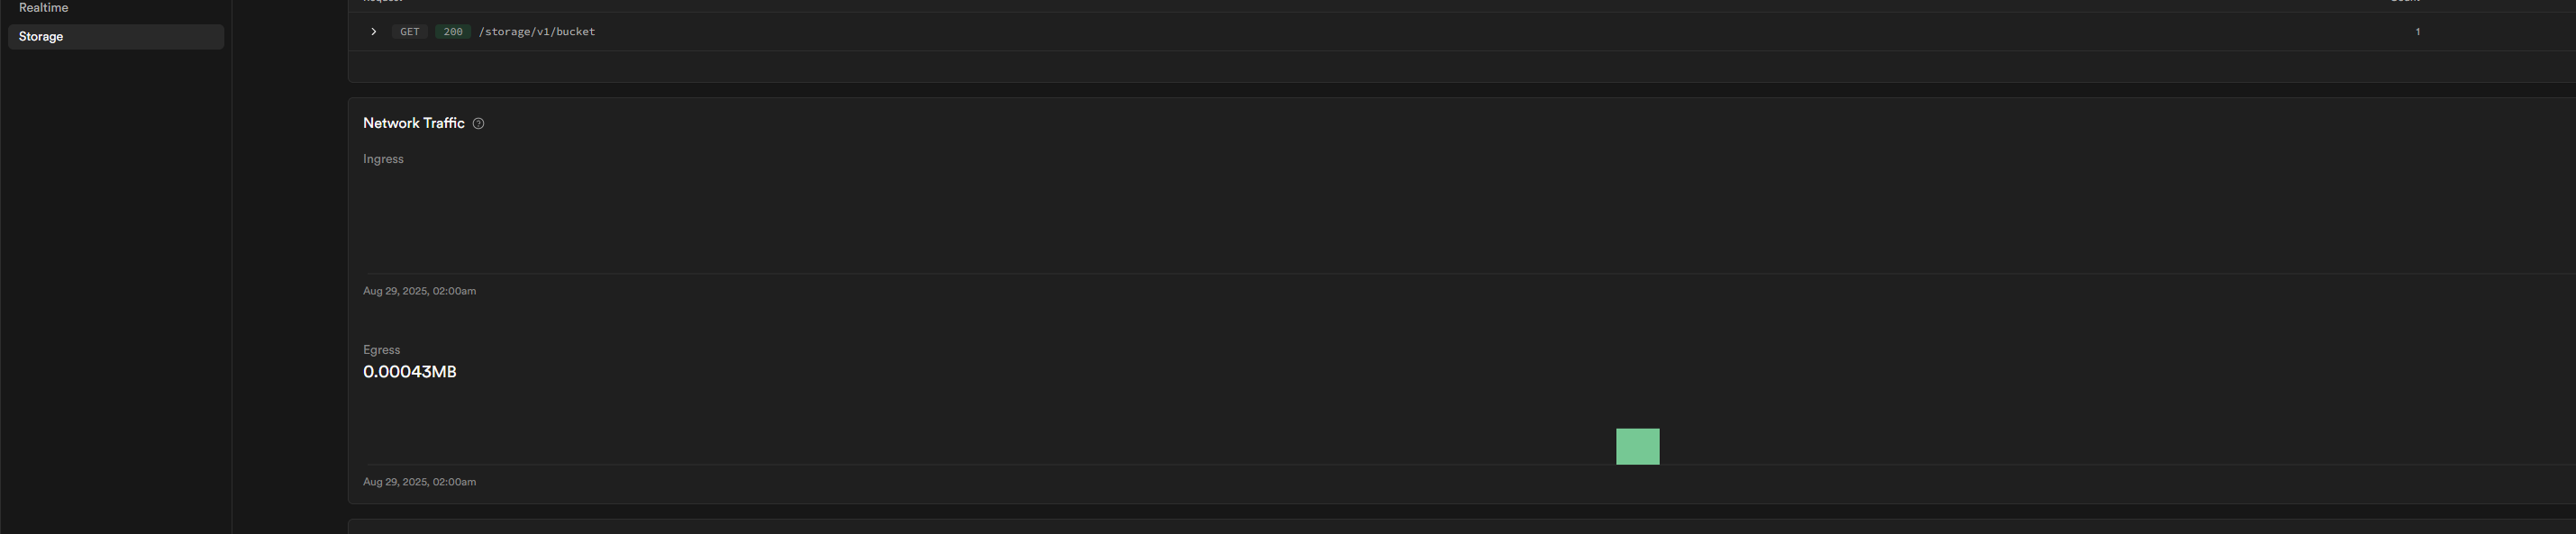
My Database Egress is showing "NaNundefined" and a negative percentage (-45.7%) in the "Egress per day" chart. The storage egress doesn't look normal also, because when checking in the report dashboard, storage egress show less than 1mb within the last 24 hour. The other metrics like Auth, and Realtime egress look normal.
I've attached a screenshot so you can see what I'm talking about.
Thanks for any help!
I'm seeing something weird on my Supabase usage dashboard and wanted to see if anyone else is experiencing the same thing.
My Database Egress is showing "NaNundefined" and a negative percentage (-45.7%) in the "Egress per day" chart. The storage egress doesn't look normal also, because when checking in the report dashboard, storage egress show less than 1mb within the last 24 hour. The other metrics like Auth, and Realtime egress look normal.
I've attached a screenshot so you can see what I'm talking about.
Thanks for any help!