C
C#4w ago
TheMux

Need help with some memory leaks

I got this file of code here. My code just runs fine over time without it, and when its running it starts producing memory leaks. I tried for 2-3 days now to fix and can't find it. It is supposed to check the status of every shard in the database and save it in the database. It always checks a maximum of 5 shards at the same time. I'm coding a discord bot with C# and ASP.NET When you need more context to fix this kind of problem feel free to dm me please Thanks
18 Replies
TheMux
TheMuxOP4w ago
Explanation of my code: ISimpleLogger is a logger interface and it just simply logs something in the console with time and colors. var client = _clientFactory.CreateClient("BotHttp"); BotHttp looks like this: builder.Services.AddHttpClient("BotHttp", (provider, client) => { client.Timeout = TimeSpan.FromSeconds(10); client.DefaultRequestHeaders.Add("X-API-KEY", provider.GetRequiredService<IOptions<BotConfig>>().Value.BotApiKey); });
canton7
canton74w ago
I don't see anything suspicious there either Are you sure you have a memory leak?
TheMux
TheMuxOP4w ago
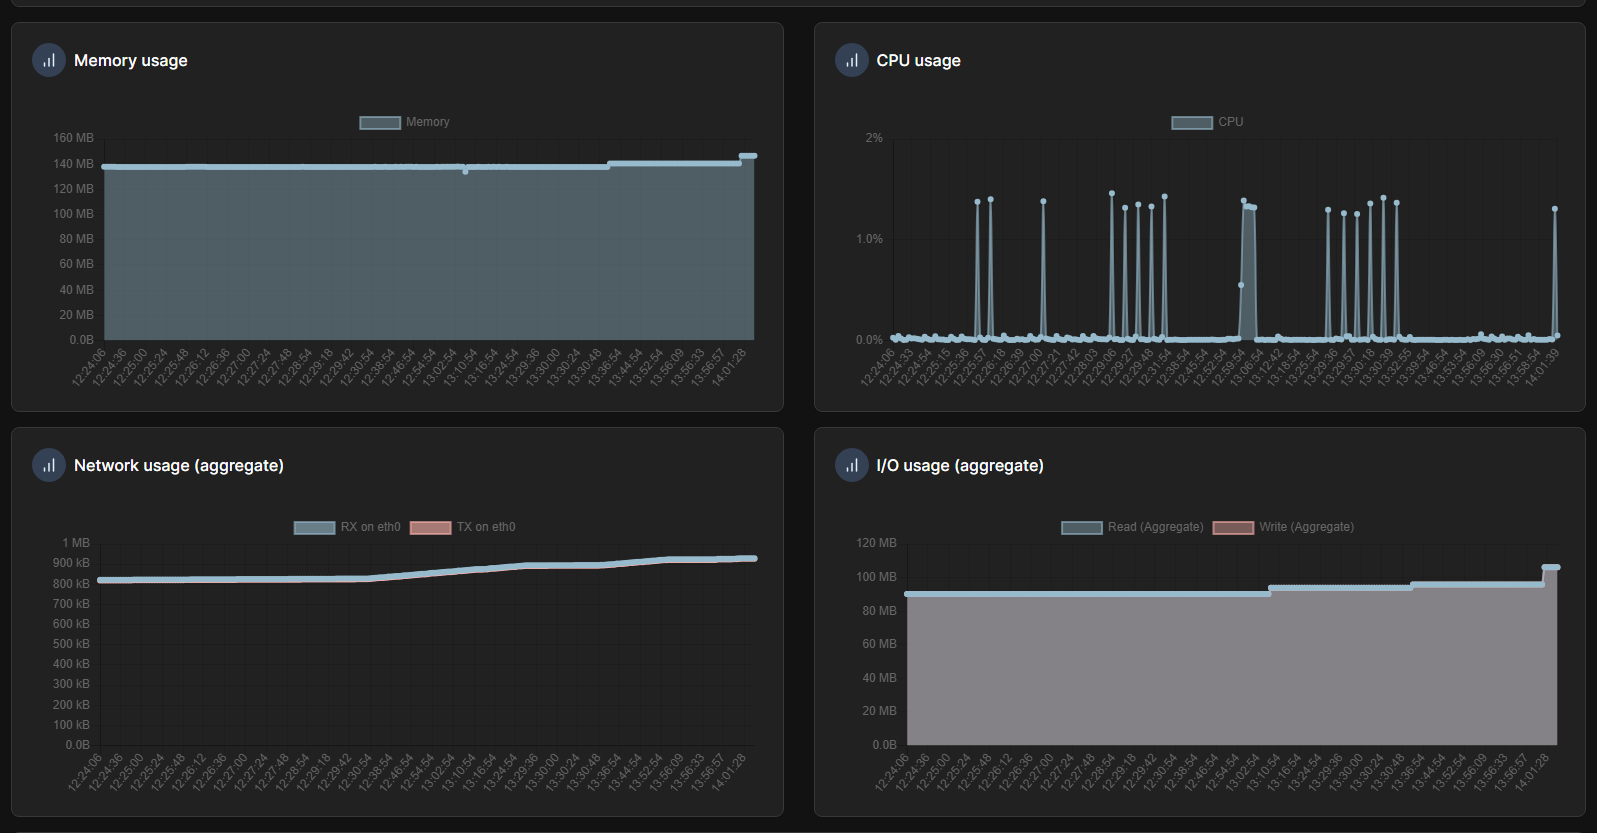
My ram just goes up like a staircase over several hours. I'm not sure
ティナ
ティナ4w ago
is there any additional cost if you perform more query? if not then make ExecuteAsync loop faster so that you can take two heap snapshots within a shorter period (or just wait and compare the objects in heap)
TheMux
TheMuxOP4w ago
Should not. I will try that and tell here
ティナ
ティナ4w ago
the "cost" i mean is the charge (money) you that need to pay (to cloud etc)
TheMux
TheMuxOP4w ago
No. It doesnt cost anything
canton7
canton74w ago
It went up by maybe 5MB in your graph?
TheMux
TheMuxOP4w ago
Yeah, its always 5-8mb then like an hour it stays the same and then again.
canton7
canton74w ago
Bear in mind that the GC will expand the memory it uses if it thinks it can be more efficient by doing that, but it will give memory back to the OS if the OS asks for it back
TheMux
TheMuxOP4w ago
Would it help to send my diagnostic session? Ah that would make sense. The first one or two hours it takes more and more and then it stays the same for like 6 hours of testing. That would explain it But is it normal that my Network Usage and I/O is rising? I'm just running this background task, nothing else
ティナ
ティナ4w ago
aggregate
TheMux
TheMuxOP4w ago
Lol, of course omg So you think it is normal and probably not a memory leak? I can watch the usage for a few days
canton7
canton74w ago
I haven't seen anything which makes me think you definitely have a memory leak Yeah I'd run it for a few days, or a week even. If it doesn't level off, then I'd start getting suspicious
TheMux
TheMuxOP4w ago
Ok, then I'll try that. Thanks for your quick help ^^
canton7
canton74w ago
👍
Cracker
Cracker4w ago
Take dump file and analyze it. Check which objects cause allocation
Lex Li
Lex Li4w ago
Please learn to use memory profilers and that can help determine whether there are memory leaks or not. Dump analysis can yield similar information but not as intuitive.

Did you find this page helpful?