Charts with JavaScript
Hello, I'm looking for a JavaScript library for interactive, responsive and accessible charts/plots. Preferably with a good React integration (e.g. components).
Any recommendations?
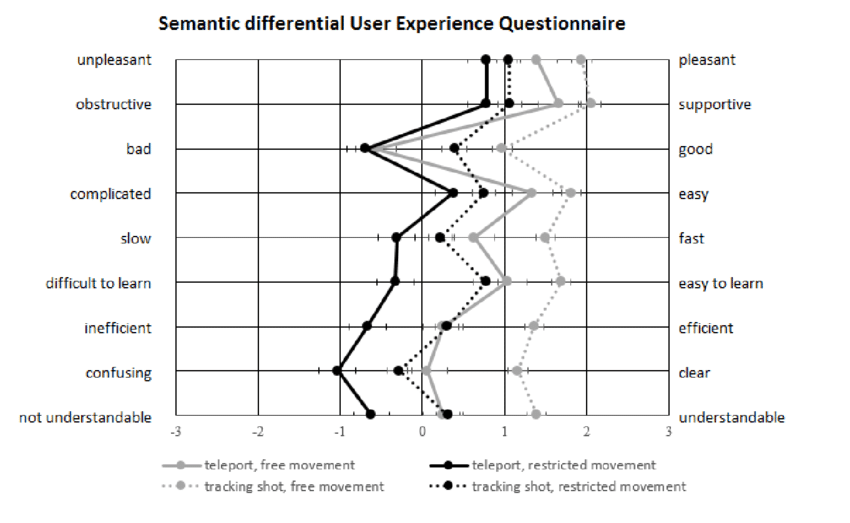
Some background: I'm planning to build a react application that plots polarity profiles (see attached image). A polarity profile is a common tool for measuring the image of products or brands. It consists of a standardized pairs of properties (two opposite verbal poles), representing the endpoints of a scale (e.g. active/passive, old/young, soft/hard). In between there are usually five or seven categories/options. The respondent must choose one of them. Once the survey is finished, you typically use a bipolar chart to analyze/display the results (average of the opposite values chosen by the respondents).
Thanks
Any recommendations?
Some background: I'm planning to build a react application that plots polarity profiles (see attached image). A polarity profile is a common tool for measuring the image of products or brands. It consists of a standardized pairs of properties (two opposite verbal poles), representing the endpoints of a scale (e.g. active/passive, old/young, soft/hard). In between there are usually five or seven categories/options. The respondent must choose one of them. Once the survey is finished, you typically use a bipolar chart to analyze/display the results (average of the opposite values chosen by the respondents).
Thanks

A friendly place for developers to meet other devs, ask questions, get help, and just have a good time 🙂.
36,263Members
Resources
Similar Threads
Was this page helpful?