Oscilloscope Online: An online Graph Plotter, A cool alternative to Arduino IDE's Serial Plotter
73 Replies
Unknown UserOP•13mo ago
Message Not Public
Sign In & Join Server To View
can it record graphs into excel/libreoffice?
Unknown UserOP•12mo ago
Message Not Public
Sign In & Join Server To View
Parallax
PLX-DAQ - Parallax
Parallax Data Acquisition tool (PLX-DAQ) software add-in for Microsoft Excel acquires up to 26 channels of data from any Parallax microcontrollers and drops
this does something similar
Unknown UserOP•12mo ago
Message Not Public
Sign In & Join Server To View
you could try to make it libre office compatible too
Unknown UserOP•12mo ago
Message Not Public
Sign In & Join Server To View
i have a doubt,the arduino cannot measure negative voltages right?how does the oscillo?
Unknown UserOP•12mo ago
Message Not Public
Sign In & Join Server To View
i see
Unknown UserOP•12mo ago
Message Not Public
Sign In & Join Server To View
my plan for my oscillo was to use an inverting op.amp on a second chanel and re flip it
lol
Unknown UserOP•12mo ago
Message Not Public
Sign In & Join Server To View
not impossible
Unknown UserOP•12mo ago
Message Not Public
Sign In & Join Server To View
https://m.youtube.com/watch?v=fmRHDqcodS4&t=307s&pp=ygUWY2lyY3VpdCBiYXNpY3Mgb3AgYW1vcw%3D%3D
this video helped me a lot
CircuitBread
YouTube
Intro to Op-Amps (Operational Amplifiers) | Basic Circuits
Operational amplifiers, or op-amps, were very confusing for me at first and in retrospect, it's because I made it too complicated for myself. So, let's keep things simple as we learn about op-amps, some of their distinguishing features, and the two important lessons to remember about them. This is just an intro and we strongly recommend watchi...
accidental time stamp
skip to 0
Unknown UserOP•12mo ago
Message Not Public
Sign In & Join Server To View
what exactly is a line follower?
cause that can be made with just one op amo
or did you not mean voltage follower?
Unknown UserOP•12mo ago
Message Not Public
Sign In & Join Server To View
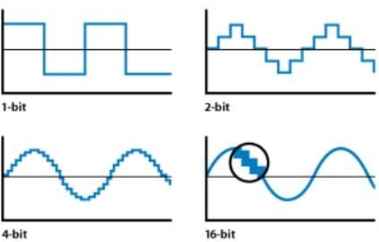
have a doubt,how far can the resulotion of the graph go?if i use an externak adc to get more bits and sampling rate can it account.for that too?
it should just be switching between anaolgue to digitak pins to do it right?
Unknown UserOP•12mo ago
Message Not Public
Sign In & Join Server To View
do you mean the pc or the arduino microcontroller?
Unknown UserOP•12mo ago
Message Not Public
Sign In & Join Server To View
i dont think rendering lines takes that much
Unknown UserOP•12mo ago
Message Not Public
Sign In & Join Server To View
libre office is open source,you could basically copy its code into yours and make it an actual graph
but i see yiur point
Unknown UserOP•12mo ago
Message Not Public
Sign In & Join Server To View
would using a function to "connect" the points in the graph to render as pixels instead of points themselves help?
it would just be anhigher resolution image
but indont know how exactly its rendering the graphs,havent looked into the code
ans importing into csv would put it in point form again
Unknown UserOP•12mo ago
Message Not Public
Sign In & Join Server To View
can you explain laymanly how your rendering the graphs?i dont know html
Unknown UserOP•12mo ago
Message Not Public
Sign In & Join Server To View
is this string the digital output from the arduinopin?
Unknown UserOP•12mo ago
Message Not Public
Sign In & Join Server To View
heres an idea:the arduino has 10 bits,so one graph could have 10 points on the y axis,and the y axis of the point displayed could just keep increasing with time to ?
Unknown UserOP•12mo ago
Message Not Public
Sign In & Join Server To View
why did you decide to make this a website?i feel an app would be better
so get the readings from the adc directly basically
im just brainstorming btw
Unknown UserOP•12mo ago
Message Not Public
Sign In & Join Server To View
what is?
Unknown UserOP•12mo ago
Message Not Public
Sign In & Join Server To View
this but litterally,
the y axis would have 10 increments,and the x increments with time
Unknown UserOP•12mo ago
Message Not Public
Sign In & Join Server To View
the resulotion can only be 10 bits
unless an external adc is used
Unknown UserOP•12mo ago
Message Not Public
Sign In & Join Server To View
also,you could use a function to connect the points and make it aooear smoother like i said
Unknown UserOP•12mo ago
Message Not Public
Sign In & Join Server To View
ok,do yiu understand what an adc is?
Unknown UserOP•12mo ago
Message Not Public
Sign In & Join Server To View
yes,the arduino unos built.in adc can only output 10 bits
Unknown UserOP•12mo ago
Message Not Public
Sign In & Join Server To View
so having a higher resolution than that will be adding inacuracies
but it can be smoothed out to have a higher resolution later,i was talking about making the graph more easy to render
Unknown UserOP•12mo ago
Message Not Public
Sign In & Join Server To View
ah i didnt know
Unknown UserOP•12mo ago
Message Not Public
Sign In & Join Server To View
cool
well the graph could be zoomed in if it worked like libreoffice or excel
Unknown UserOP•12mo ago
Message Not Public
Sign In & Join Server To View
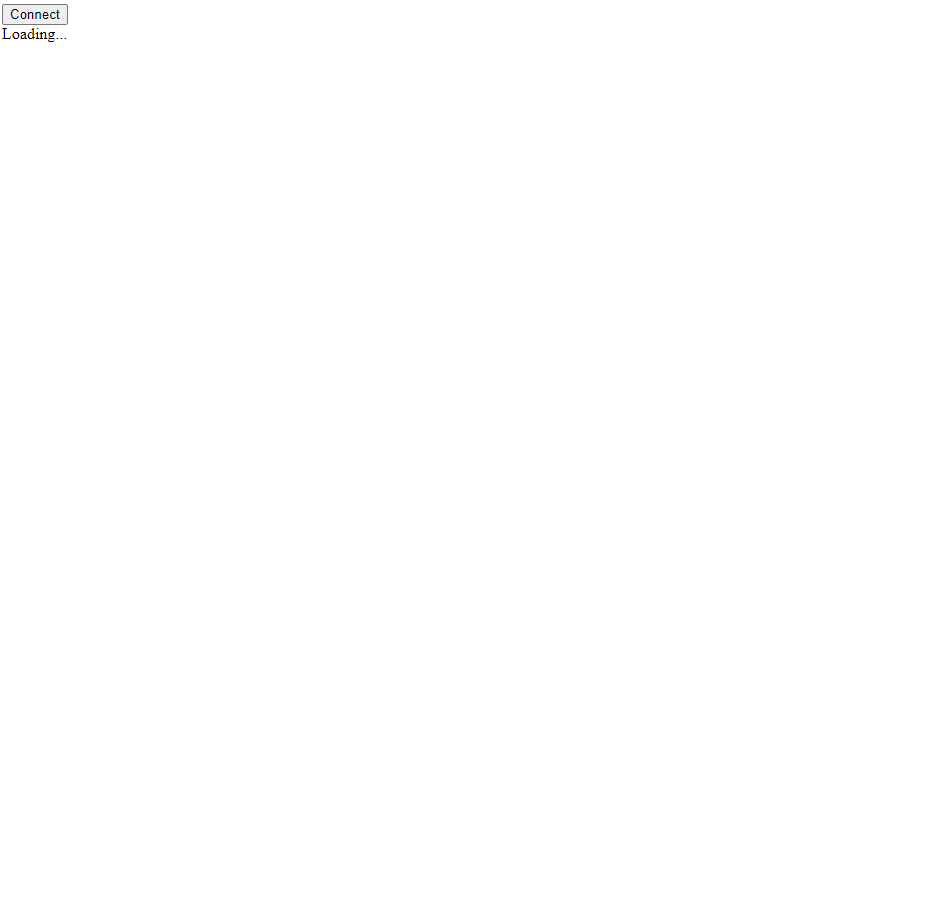
It doesnt really want to work for me
Unknown UserOP•12mo ago
Message Not Public
Sign In & Join Server To View
Also I was trying to use a baud rate of 115200
Do you have an example arduino code?
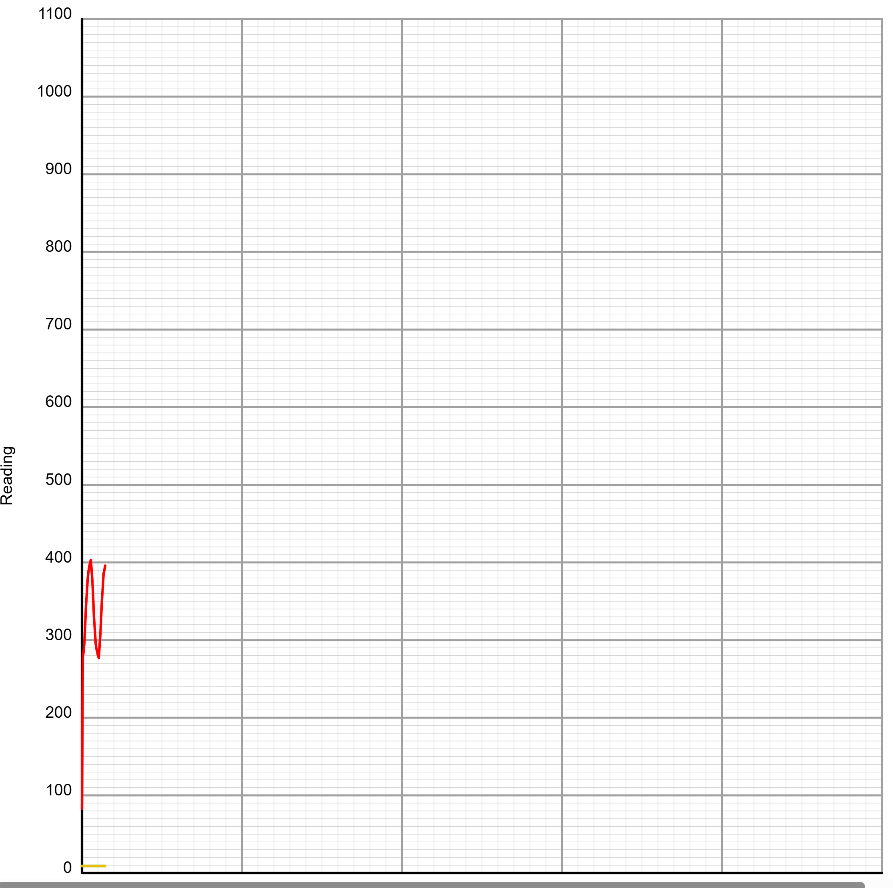
I got it to work but only for like 100 readings, and only once
Do you have any idea what might be wrong?
Like this
Unknown UserOP•12mo ago
Message Not Public
Sign In & Join Server To View
Is the 100 ms delay necessary? I wanted to use something like in the kHZ range
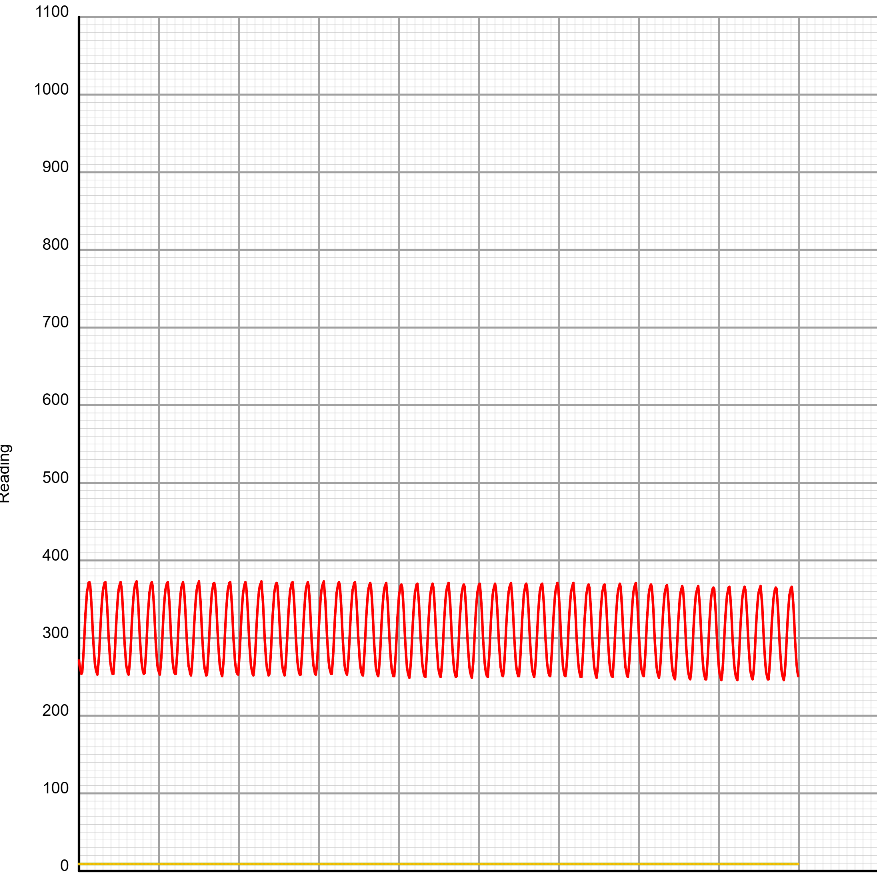
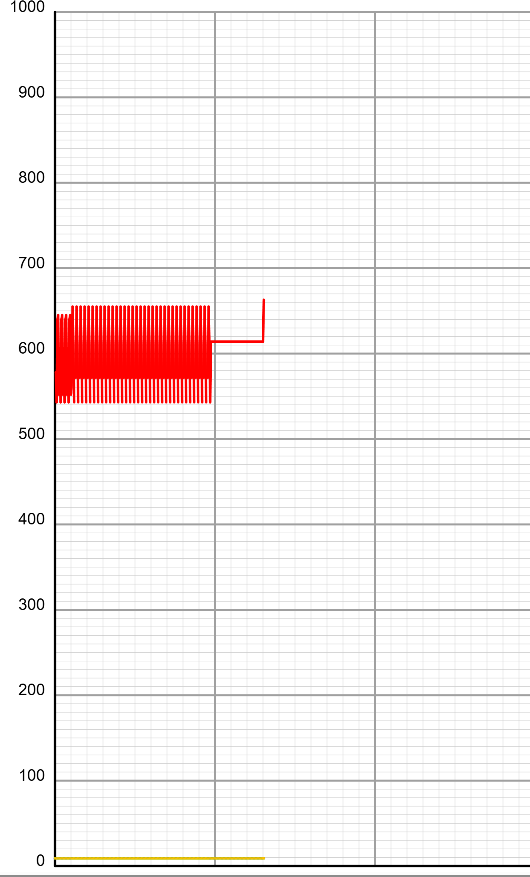
Now thats a nice sin wave from inductant noise of mains voltage
Unknown UserOP•12mo ago
Message Not Public
Sign In & Join Server To View
Yea I know. I was just asking about the limits of the display
Do you maybe plan on making it like a real oscilloscope in the running option?
Unknown UserOP•11mo ago
Message Not Public
Sign In & Join Server To View
I used it for testing an LC tank circuit, worked but not good. (Not your fault, you fixed the problem)
It didn't work because of my component selection