How to investigate usage spike
Hi all, we experienced an odd usage spike on Jan 12. We usually sit around 0.35 hrs daily, fairly consistently. However, we noticed that on Jan 12, we had 4.6 hrs request time. We can see in the "Request time by source - Triggers" view, that this trigger has used 4.36 hours:
GET /api/collections - Routes - 4.36 hours
However, we are trying to track down if this is coming from one specific merchant, or what has caused this spike. In the "Request time by source - Shopify Domains" view, the store with the highest usage says it's only used 0.13 hours (2%).
I'm wondering if you can advise us on how we can investigate this further, or if someone can take a further look into this for us?
Thank you so much,
Adam
9 Replies
Hey @Chocci_Milk is there any chance you could please help me with this?
Hello,
Sorry for the late reply. We had a very busy week last week and I wasn't able to get to everyone's questions.
Unfortunately, when it comes to API calls to routes, sometimes we can't get the information to put the usage under the correct category. I can possibly help you look into it if you share the URL of the application.
Side note: It might have been a request from an external source. Have you folks added CORS, rate-limiting and response caching to your routes?
Here are some docs that might help you folks further protect your application:
https://docs.gadget.dev/guides/http-routes/route-structure#route-plugins
https://docs.gadget.dev/guides/http-routes/route-configuration#cors-configuration
https://docs.gadget.dev/guides/http-routes/route-configuration#response-caching
https://www.npmjs.com/package/@fastify/rate-limit
npm
@fastify/rate-limit
A low overhead rate limiter for your routes. Latest version: 10.2.2, last published: 10 days ago. Start using @fastify/rate-limit in your project by running
npm i @fastify/rate-limit. There are 64 other projects in the npm registry using @fastify/rate-limit.Route Structure - Developer Docs - Gadget
Gadget Docs
In general, it might also be a good idea to add some external login like Axiom so that you can aggregate values logged in routes.
You could look at the origin or referer headers' values to determine where the call is coming from
Hey @Chocci_Milk , thank you very much for your reply. Apologies, I didn't mean to sound like I was hassling you. I just thought my question may have gotten lost down the list.
Thank you very much for your reply. We'll definitely check into all of those links and recommendations.
I have just sent you a DM with my app URL if you don't mind taking a quick look?
Thank you Antoine,
Adam
It's no problem, I just wanted to let you know why the response was delayed
Looks like you had only ~3k requests to that route the whole day. Most of the requests were really short at about 14-25ms per but your average request time is 4,478ms/req.
The spike in average request time was from 12am-1pm and it looks to be following the amount of traffic you had at that time.
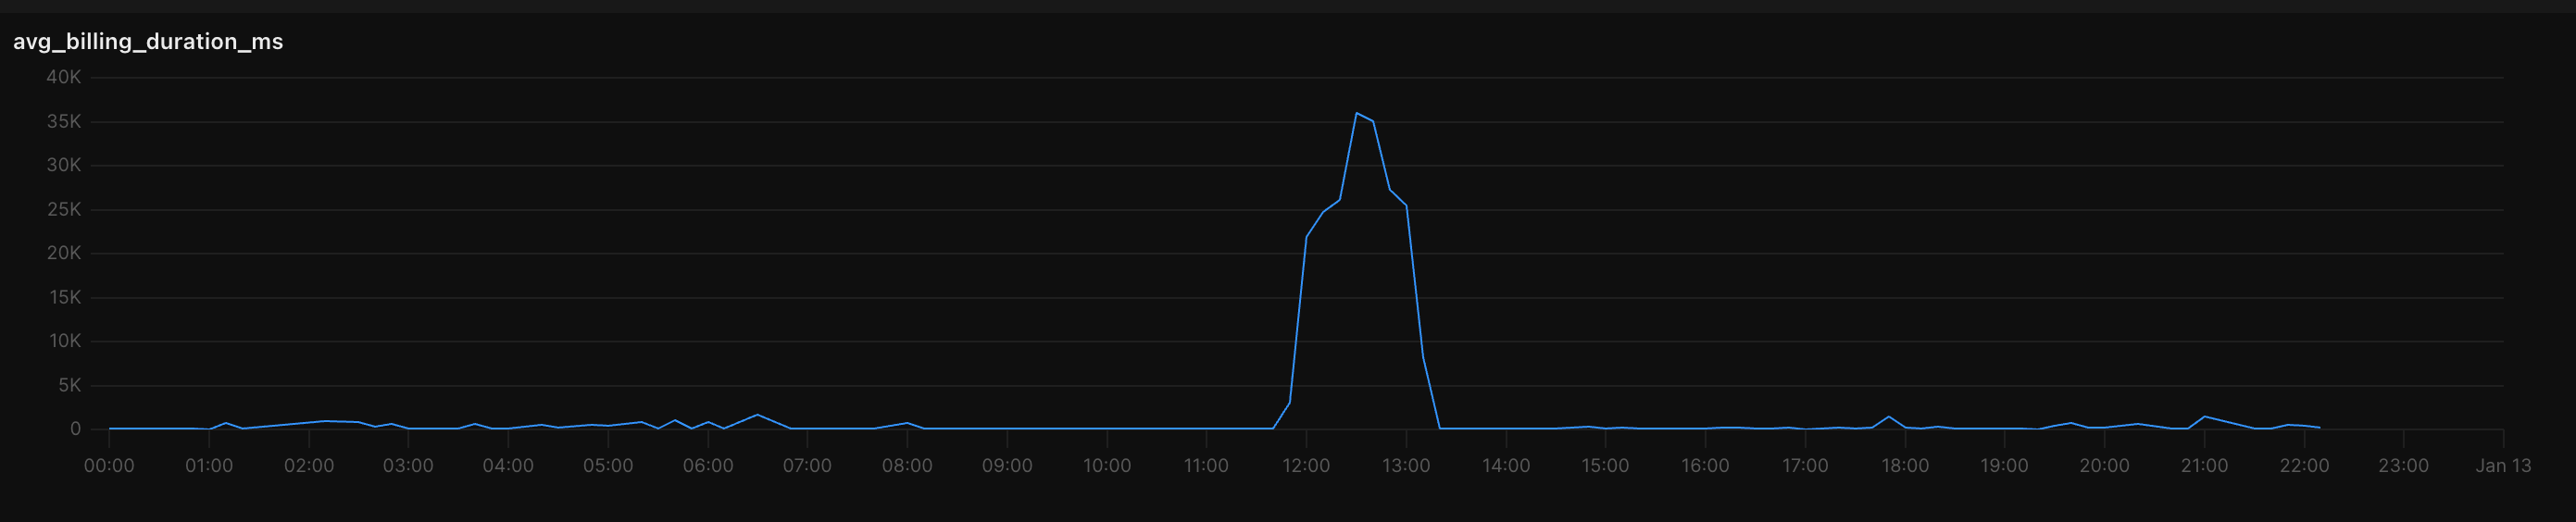
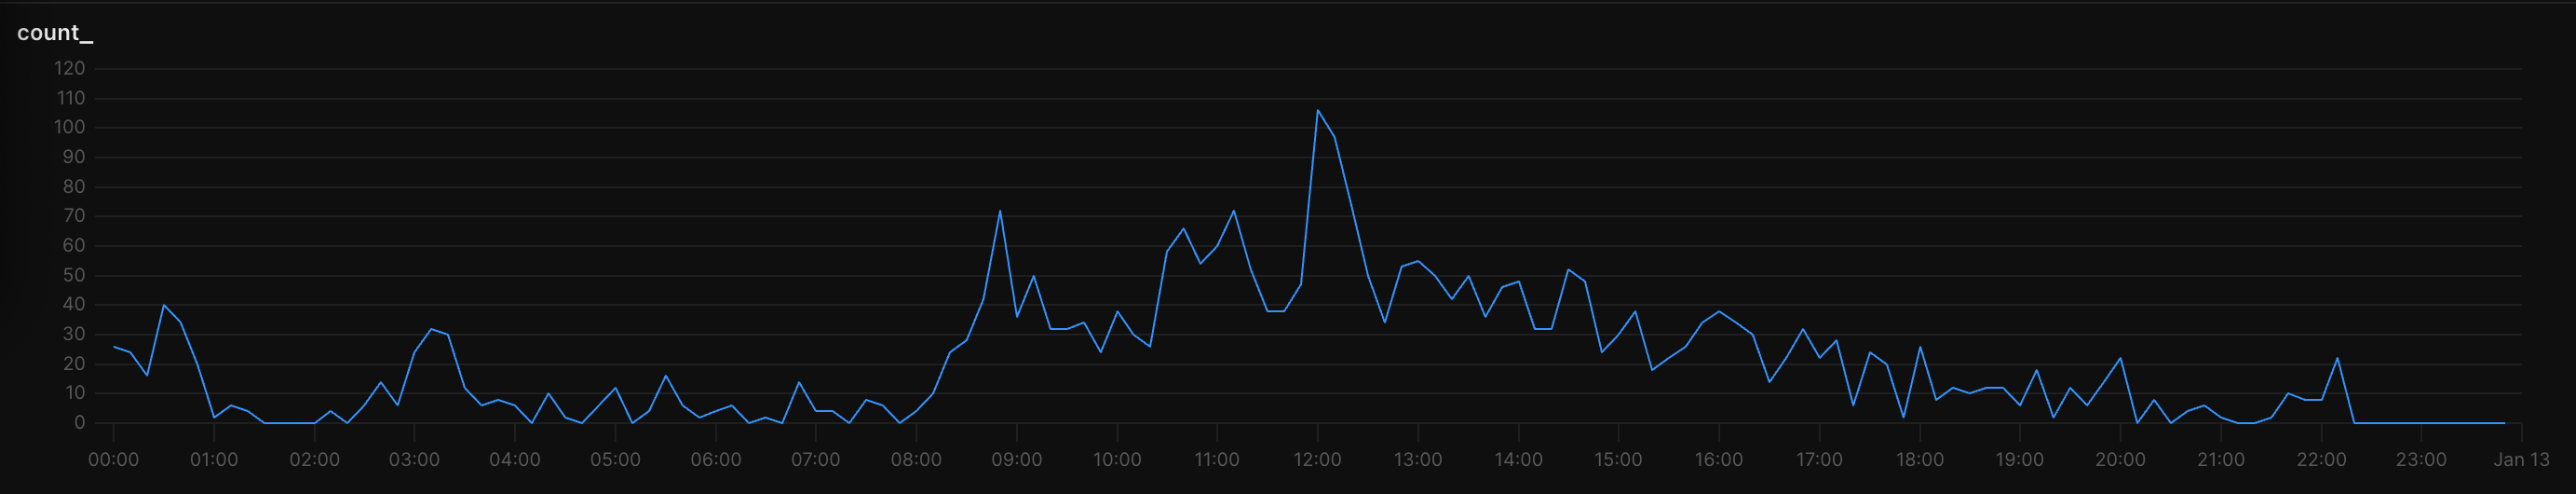
Zooming in, it looks like you'd get blurbs of high traffic and then the average time would go up. I think that this means that you might need to start to throttle and/or rate limit the requests
What is this route used for?
Btw, I see that you're passing some information to the runCacheJob function (api and connections). You don't need to do that. You can simply import those from
gadget-server
Could you not also simply use the connections.shopify.currentShopId value in that function when calling migrationUpdate?Hey @[Gadget] Antoine , thank you very much for your replies. We're implementing your recommendations as we speak.
Thanks again for all your time and help Antoine, this has been incredibly helpful. 🙏
No problem, please let us know if you need anymore help investigating