Zero Prometheus metrics parser ok but parser is considered as ok
Hello,
I created a custom parser (named
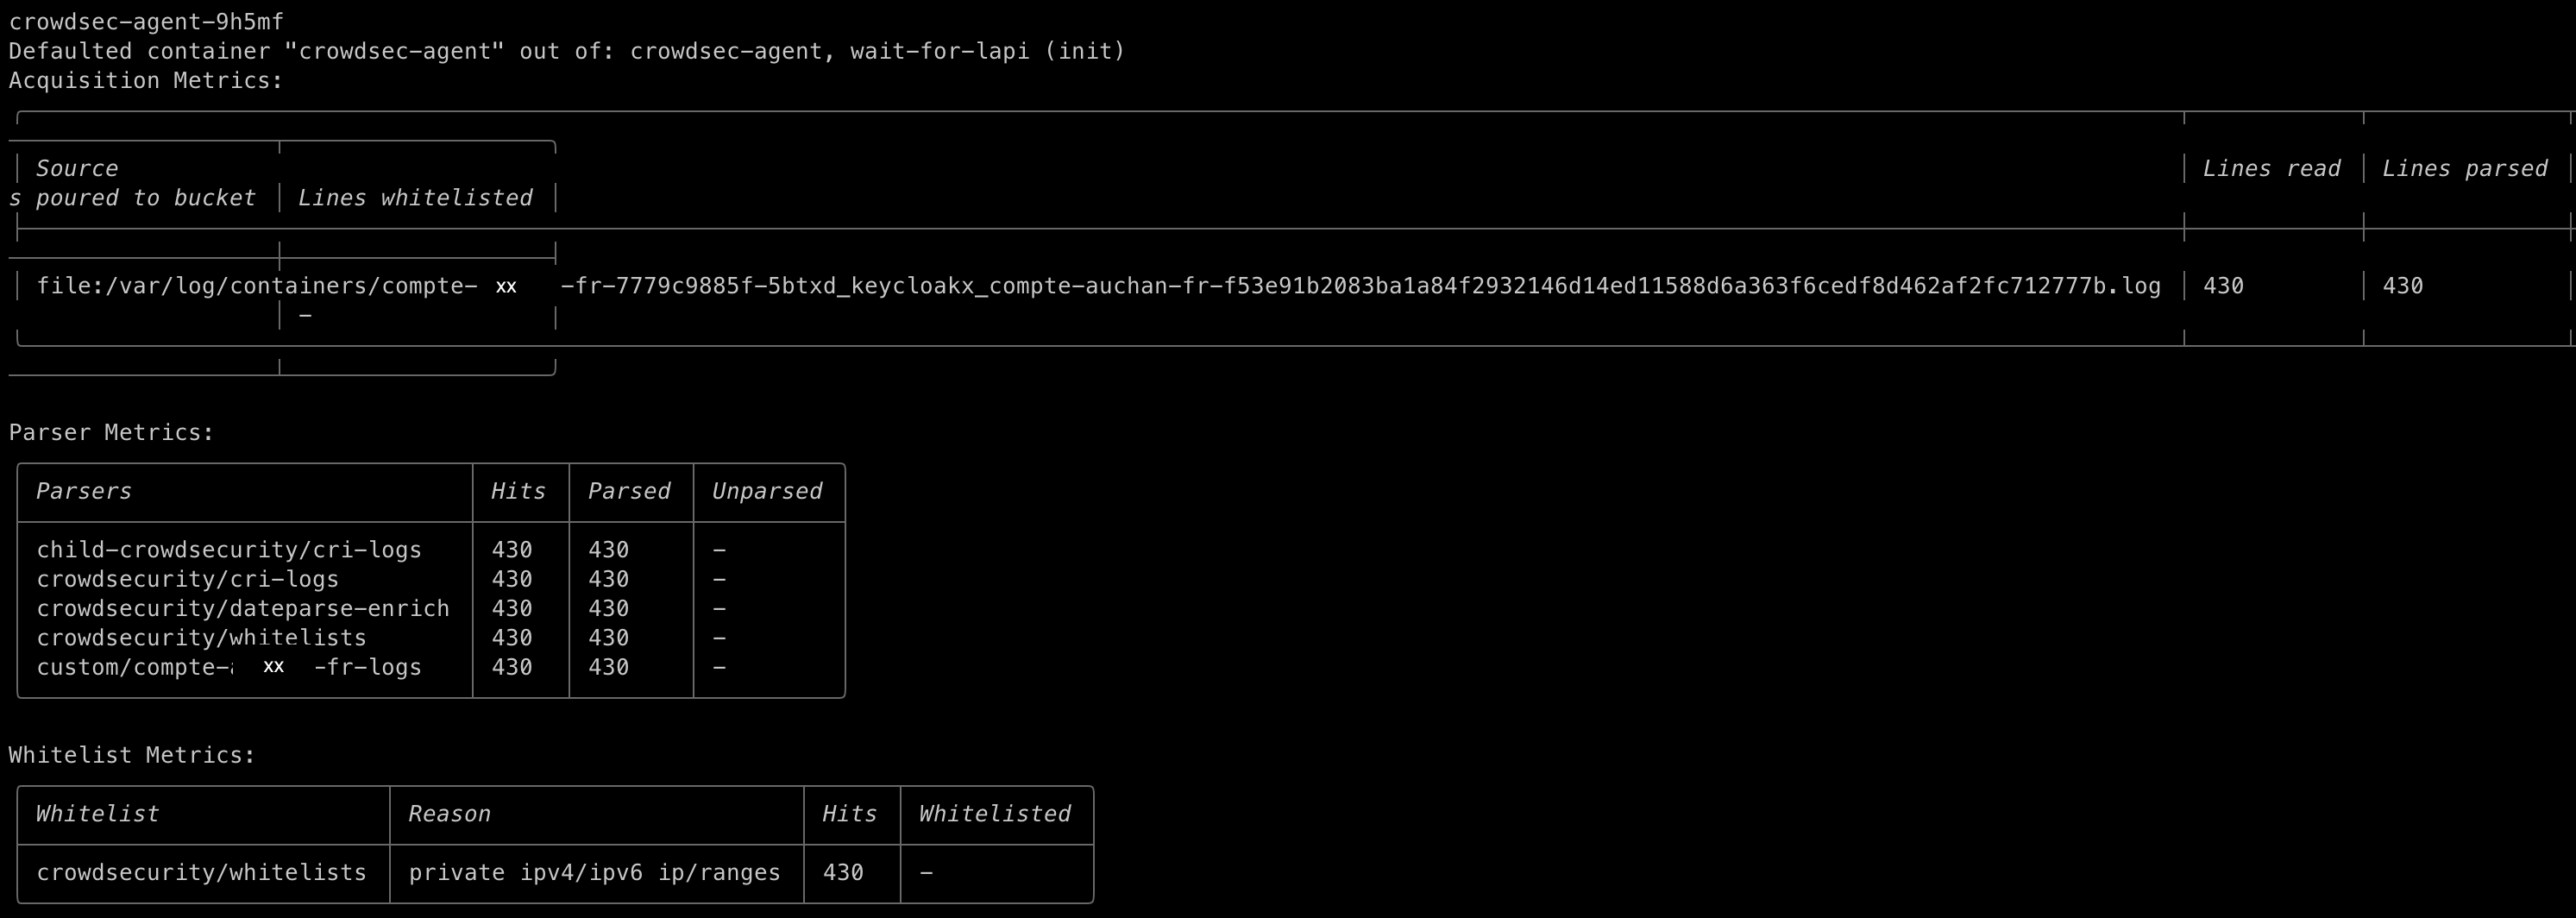
compte-xx-fr)that succeeds in reading lines (I see it by running cscli metrics command).
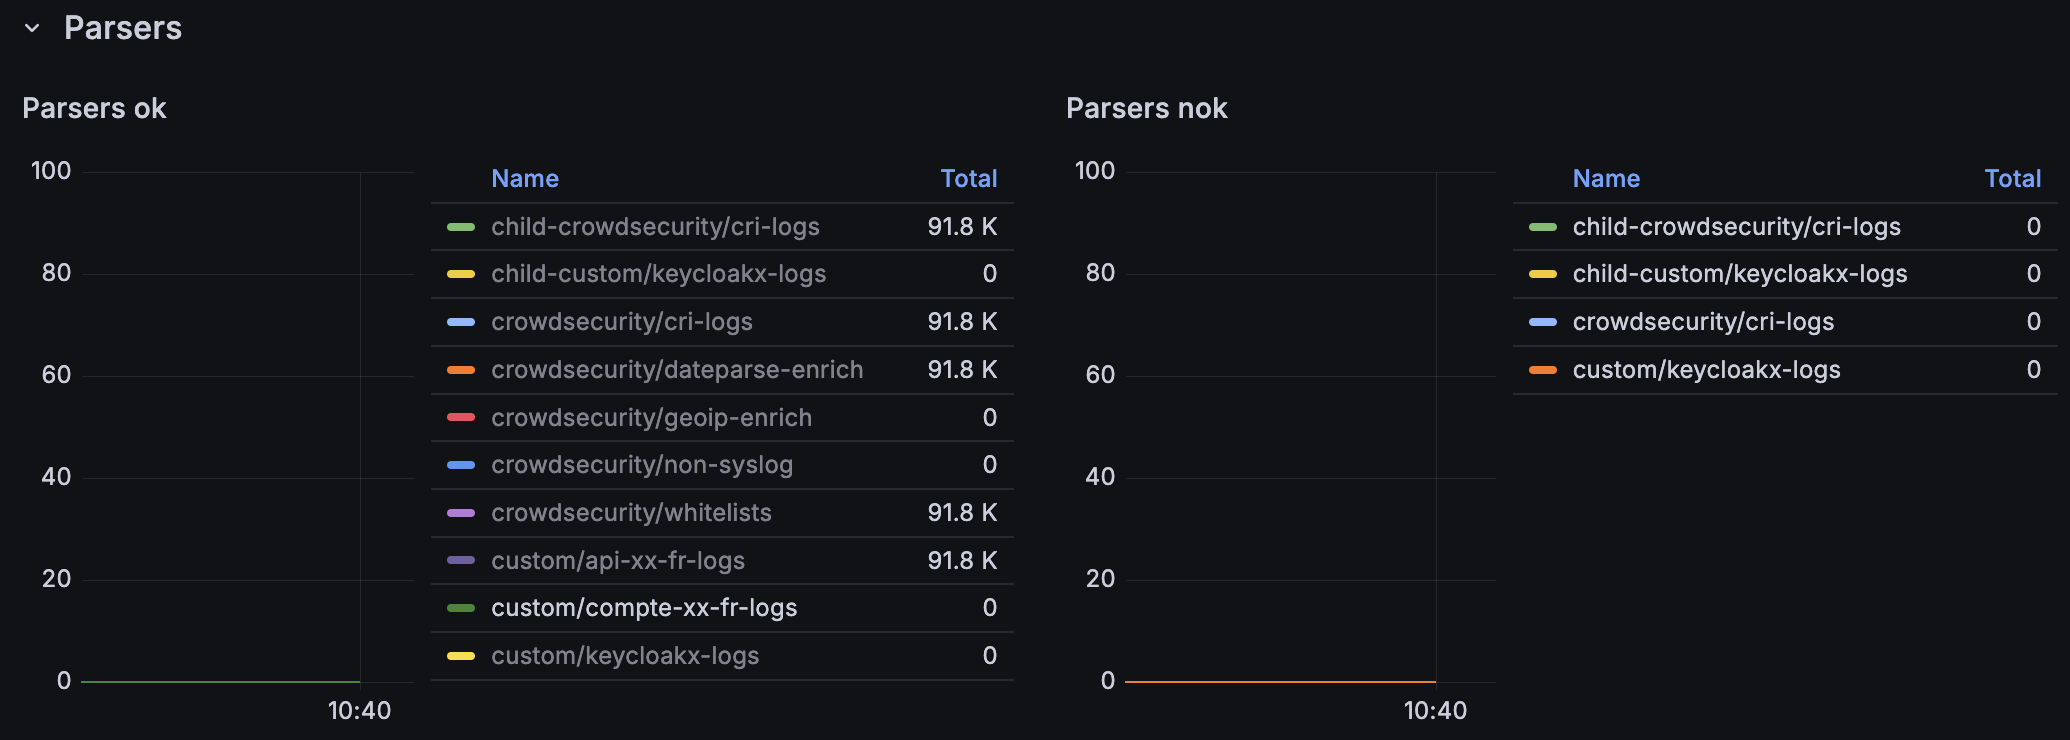
But on my grafana dashboard, there is 0 peak for this custom parser, even though it is in the "parser ok" grafana panel (as attached).
Could you tell me why ? As I think my custom parser configuration seems good.
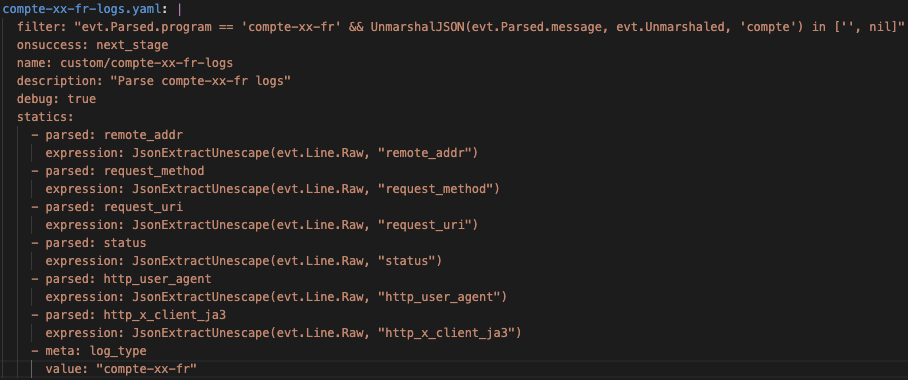
I attach also my custom parser configuration.
I'm in app version 1.6.4 deployed through helm.
Thanks in advance,


25 Replies
Important Information
This post has been marked as resolved. If this is a mistake please press the red button below or type
/unresolve© Created By WhyAydan for CrowdSec ❤️
So you have a mixture of json extraction here in the filter we are using the unmarshaljson feature which will extract all keys to
evt.Unmarshaled but then in statics we are trying to reextract them using jsonextract
You should use the logic of instead of jsonextract you do evt.Unmarshled.compte.<key> or evt.Unmarshaled.compte.<key>.<subkey>Alright so what should be the updated parser configuration?
but it also looks like your API parser is catching everything
is there a reason why you have multiple parser that seem to be parsing the same file or log stream?
what do you mean ?
actually my custom parsers don't parse the same file
and within the acquisition you have set the correct type label and they dont overlap?
cause you
evt.Parsed.program == XXXX and they dont clash?they don't seem to overlap
hmmm and the log lines are definately json?
look
here is the log type
Since the logic is very similar, are you doing something different in the scenario? based on type?
And could you share the generated acquis from within the agent? or the values section?
My opinion is to only have one parser and do this?
Update filter to get both types:
Update statics to use
evt.Unmarshaled.auchan as the key now
Then update the meta log_type to be an expression that returns the program type:
and then your scenarios can only use what they need to use as it seems the json format is the same.
but also if you want to keep them seperate for tracking, most likely the jsonextract is causing issues since evt.Line.raw is including cri-logs format so if you look at your other parser, you should follow the same format, but change evt.Unmarshaled.api to evt.Unmarshaled.comptei'm gonna check
You need to update the statics
it no longer
.api but .auchan
plus I would update naming for the files and name key so it clear but its not vital for testingalright
i'm testing
hmm but if you give it sometime, do you actually see it increaing within
cscli metrics cause both use prometheus.
cause if it increaing on cscli I say there an issue collecting somewherei still see parsed lines and even scenario triggered
so cscli uses the prometheus metrics to display information?
Yes exactly
so if
cscli metrics is still increasing in metrics (cause I expect this not to go up), then there an issue on either collector or filters in grafanahere is the expression of this grafana panel :
sum(increase(cs_node_hits_ok_total[$__interval])) by (name)
if I understand the situation, it may be due to only a display error?
hum actually there is no increasing, as now it's still the same parsed lines than 5minutes ago
And it's still the same parsed lines number now
according to cscli metrics command on one agent
on other crowdsec agents alsoAnd if you go to the log file within the cluster is the node still taking requests?
/var/log/containers or there a new file we do add force inotify
Yes, maybe the cluster has rotated or created a new container?if so, yes it's still taking requests
dont think so
this file /var/log/containers/api-auchan-fr-7c7c4b8bc8-9qb8l_gravitee_nginx-35aa358d0b98d0ced16ed44d7c88b59cf77b6d72ae8c3956107627c2c70c954a.log is still taking requests
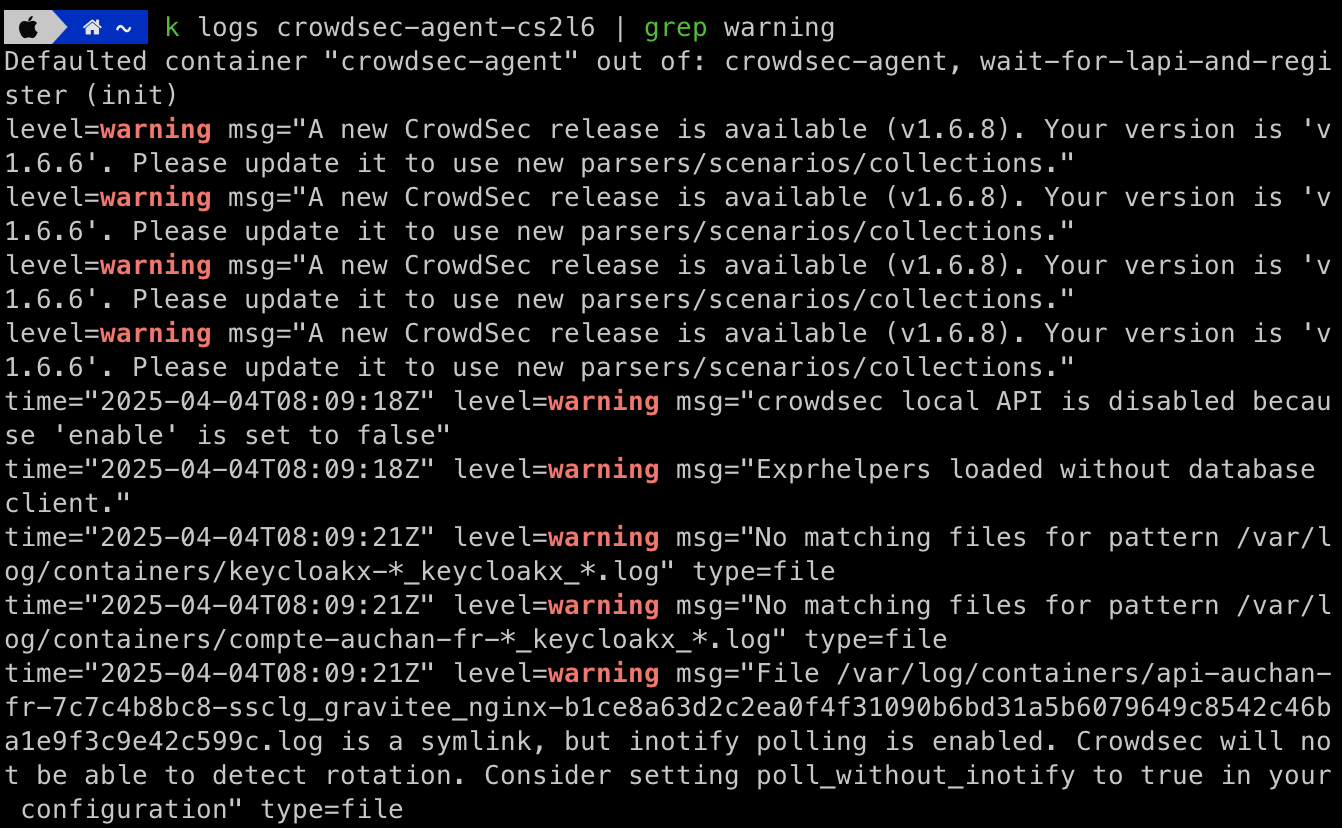
Can you check the agent logs see if there anything useful?
do you know how I can resolve these errors?
the prometheus metrics went down till 0 this night, and goes up at 8:50AM this morning
also :


I enabled poll_without_inotify and log rotated, so it's ok
you can resolve the ticket
Resolving Zero Prometheus metrics parser ok but parser is considered as ok
This has now been resolved. If you think this is a mistake please run
/unresolve