opentelemetry_ash not ready for use or not properly configured?
Hi!
We're struggling with some performance issue in prod and can see some gaps between the top level spans (typically, LiveView event handlers) and DB queries. So there's a suspicion that something might be going slow in building queries and/or processing results.
So we've tried enabling opentelemetry with the
opentelemetry_ash package (0.1.0). But it doesn't seem to hook correctly into the parent spans, looks kind of useless and hard to navigate. We use SigNoz to visualise the spans, it looks like on the screenshot.
Here's the config:
Is there something wrong with our config or with opentelemetry_ash?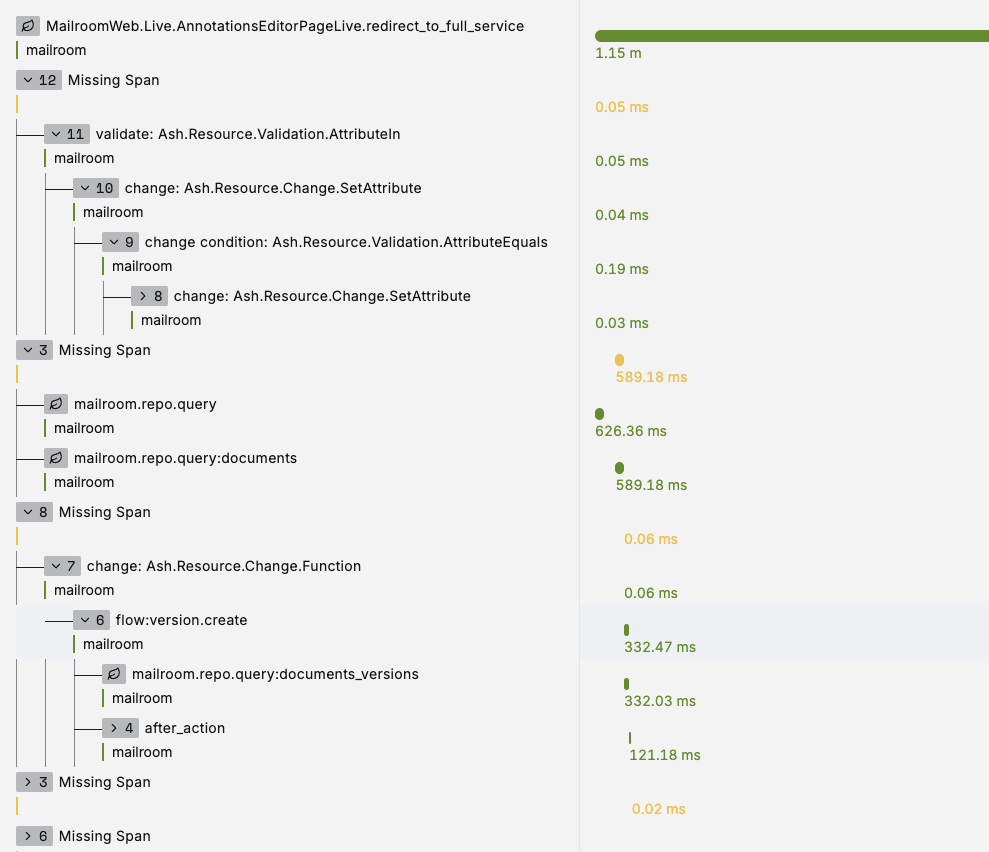
30 Replies
Hm... that does look quite strange. Would you be able to contribute a test to opentelemetry_ash that starts a non-ash span and then calls an action, and asserts on the outputted spans relation? It's a pretty simple package and I've moved on from the app where I was using it in anger so maybe something has changed/broken.
I would love to, just have to find the time. The first priority now is to fix our performance issues, but since there's a suspicion of Ash being involved, I might need to have some Ash telemetry up and running.
It seems like you're getting telemetry there despite it somehow missing a parent span
What can you tell me about your perf issue?
Oh I could say a lot :), we still don't know what exactly is causing the issues, they're also "flaky" - as in sometimes it's worse than others. We're hosted on Fly, and sometimes a region change or a restart solves everything (for some time).
But the longest telemetry spans have huge gaps between Ecto traces, where no application code is executed.
Like this one, for example (see screenshot), is produced by this event_handler in LV:
The form submit produces the left-most DB queries, the
state_module.start is probably what produces the right-most. The action is a create with one after_action hook that inserts a related record (can't remember why manage_relationship didn't work in that case).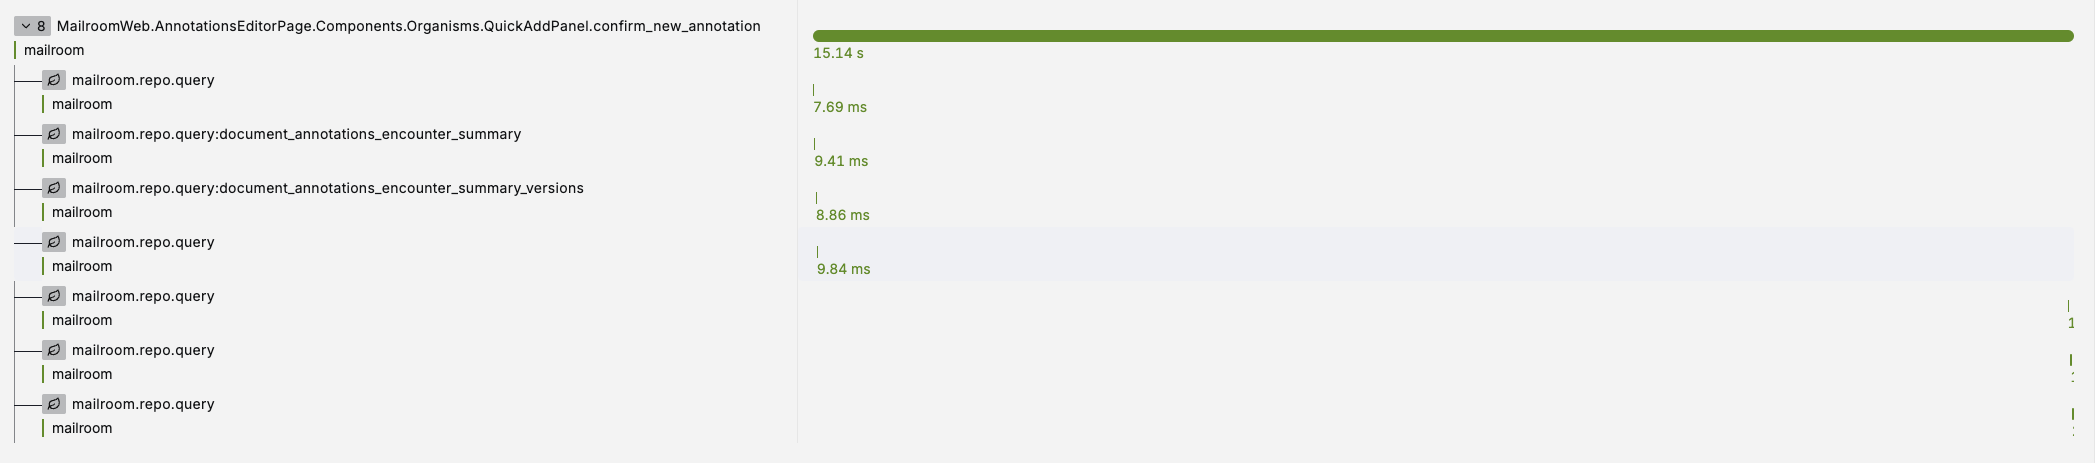
Hmmm, interesting - I've just tried (locally) to get the
opentelemetry_ash library from github instead of 0.1.0 and it seems to produce beautiful traces, all ordered correctly.
So perhaps the latest published version is not the greatest? 🙂Well, there are specifically changes to parent span tracking
So yes that could be it
Something seems very strange there
Ash doesn't do that much outside of ecto
It runs your hooks etc.
Are there hooks or anything like that on the action?
sorry, you already said so
I'm going to update the tests to do some better assertions on the span relationships
Also FWIW
opentelemetry_ash is like 100 LoC
so you could adapt it to your own needs or fix pretty easily, if you're already proficient with otelOne of the current suspicions is that we heavily rely on PubSub to keep the LV up to date. And pretty much every Ash action broadcasts to PubSub. So it might get noisy. But not all the handlers are very efficient at picking those up, some just do a "reload all". So we may be seeing message boxes of LVs getting backed up. This could explain some of the symptoms, but not everything. It doesn't explain, at least not to me, why the kind of code posted above would take 15 sec to finish...
🤔 that could be related, yes
But I agree with you on why it would take 15s
How are you tracing the actual event handler itself?
one other question:
the perf issue is something you've observed directly right? Not just via like otel metrics?
The perf issue has been observed by our customers, internal users, and also personally. However, mileage may vary per user (might depend on the machine, we're running a cluster of 4 machines).
👍 just wanted to rule out some problem w/ the observability tooling itself
LV event handlers are simply traced by
OpentelemetryLiveViewIs it localized to this specific event handler?
Or are you seeing this in various places?
Are there any related usage metrics spiking? high mem/high cpu?
Unfortunately, it's all over the place. Page mounts/handle_params, all kinds of event handlers. And this does not correlate with any high RAM or CPU usage 😦
🤔 how interesting
Good and bad news potentially though
how about database load?
Hm, I just saw
flow:version:create
are you using Ash.Flow?Database load is also pretty calm, CPU hovering around 50%, lots of memory, no long-running queries, enough connections.
are you using Ash.Flow?no, one of our domains is called "Flow" 🙂
okay, good 😄
I was sweating for a sec
since that was deprecated years ago haha
So it being related to notifications sounds very possible, given that we see the after action hook ending but the action not returning
Do you have this reproduced anywhere other than production?
Nope, only production
🤔 you've mentioned a restart sometimes helps
Which implies something is "building up"
Have you seen things like the effects of pubsub "slowing down"?
like live-reactivity feeling very slow?
Are you a very high traffic app? How much of your UI is pubsub driving? What if you just disabled pubsub? Would things all come crashing down?
Disabling PubSub would most probably break quite a few bits of UI, some updates happen deep in the component tree and are implemented as fire-and-let-parent-LV-handle-it. So it would require some UI work.
There's a lot reactivity - everything is live (multiple users can watch the same "document" at the same time), although it's not really a multiplayer editor experience, there's only one active user.
There are hundreds of LVs open during business hours, so not extreme (B2B).
And when the slowdowns happen then people start complaining that "everything is slow". From what we've gathered and seen ourselves, it's really a lot of things - page loads during navigation & live-navigation, LV events that result in Ash actions and DB state updates.
Are there any paths that are slow that don't include Ash?
That you've seen, at least?
"when the slowdowns happen", so normal state is "things are fine and snappy"?
And then something starts happening and things get slow? Does it return to normal at some point?
I've just pushed something up to
main for opentelemetry_ash. The testing exporter doesn't show me parent span ids, nor does the stdout one as far as I can tell? This tooling is not always the easiest to work with. But there is a place I can provide the parent span that I wasn't.
But you could try that out locally to see if it resolves your orphan span issues at least
Are you pretty recent on your Ash version?
I could add some additional tracing that could tell you more about what is going on
For instance, I could add tracing for notifiers
in fact, I want that for myself 😄Does it return to normal at some point?It's still slow (compared to what it should be), we have some UI actions taking seconds instead of ms. But once it gets really bad, I don't remember it coming back to "relatively normal" by itself - only hard reset/redeploy. We've been trying many things, the experiments haven't always been very scientific. Ash 3.4
I'm familiar withthe process of trying to balance "make our customers not lose their shit" and fixing the issue
😆
I think our best bet is to just increase the surface area of the tracing in Ash
If you can't tell if Ash is the problem, then we aren't emitting enough tracing info
I'll do this now, but to use it you'll need to update to the latest
not sure if thats on the table or not
I'll probably be able to see more tracing tomorrow (based on what's on main of
opentelemetry_ash).I unfortunately could not verify that it does what its supposed to
you'll want to check locally
I don't have a deployed app using otel, and probably just me forgetting how it works but the exporters in test don't say what their parent span is?
just getting huge tuples and guessing whats what isn't easy and the otel docs aren't that helpful
Question
whats your logging situation in production?
We've had a lot of customers hit weird perf issues often by backing up against their logger
I found something that works for me locally - install SigNoz locally and use it to visualise opentelemetry (all from localhost)
We log in JSON, but just to stdout IIRC, the logs are then picked up from Fly
Whats your prod log level?
Have you tuned the logger settings at all?
I've shipped a new notifier trace type to
mainprod.exs:
I'd look at the message queue size of your logger process
thanks for all the questions and help, by the way!
you can try increasing your sync threshold
If you're logging like a whole lot
once you have 50 logs waiting to be logged, everything starts waiting on the logger