Week 134 — What is JFR (JDK Flight Recorder)?
Question of the Week #134
What is JFR (JDK Flight Recorder)?
11 Replies
JDK Flight Recorder is a low-overhead profiling tool built into the JDK. It can collect various events from the JVM like information about the garbage collector, IO, the JIT, profiling data or custom events.
JFR can be enabled when starting a Java application with the
-XX:StartFlightRecording option, e.g. java -XX:StartFlightRecording -jar app.jar.
That CLI option can be customized with many options by adding an = after the -XX:StartFlightRecording followed by the options separated by commas. For example, dumponexit=true can be used to ensure the JFR recording gets saved when the Java application stops and filename=recording.jfr configures it to write events to the recording.jfr file.
In addition to CLI options, it is also possible to start a JFR recording at runtime. This can be achieved using the jcmd command that can interact with running JVMs. Running jcmd shows a list of running Java processes along with their process IDs and the command jcmd <process ID> <diagnostic command> can be used to run a jcmd command in a given running JVM.
For example, jcmd 12345 JFR.start starts a JFR recording for the JVM running in process ID 12345, jcmd 12345 JFR.dump would write that recording to a file and jcmd 91649 JFR.stop would stop the recording.
JFR is designed to be enable when the application runs in production with it typically introducing less than 1% performance overhead with the default configuration. Enabling JFR can help diagnosing issues with the application (e.g. performance issues or crashes).
JFR recordings can be viewed using the jfr tool that is included in the JDK. The jfr print command can be used to print all events fired during a JFR recording (e.g. jfr print recording.jfr) and the jfr view command can be used to view specific types of events (e.g. jfr view gc recording.jfr shows garbage collection events saved in recording.jfr).
For example, assume the jfr print command includes an event similar to the following:
With this, the jfr view gc would include the garbage collection in a table like this:
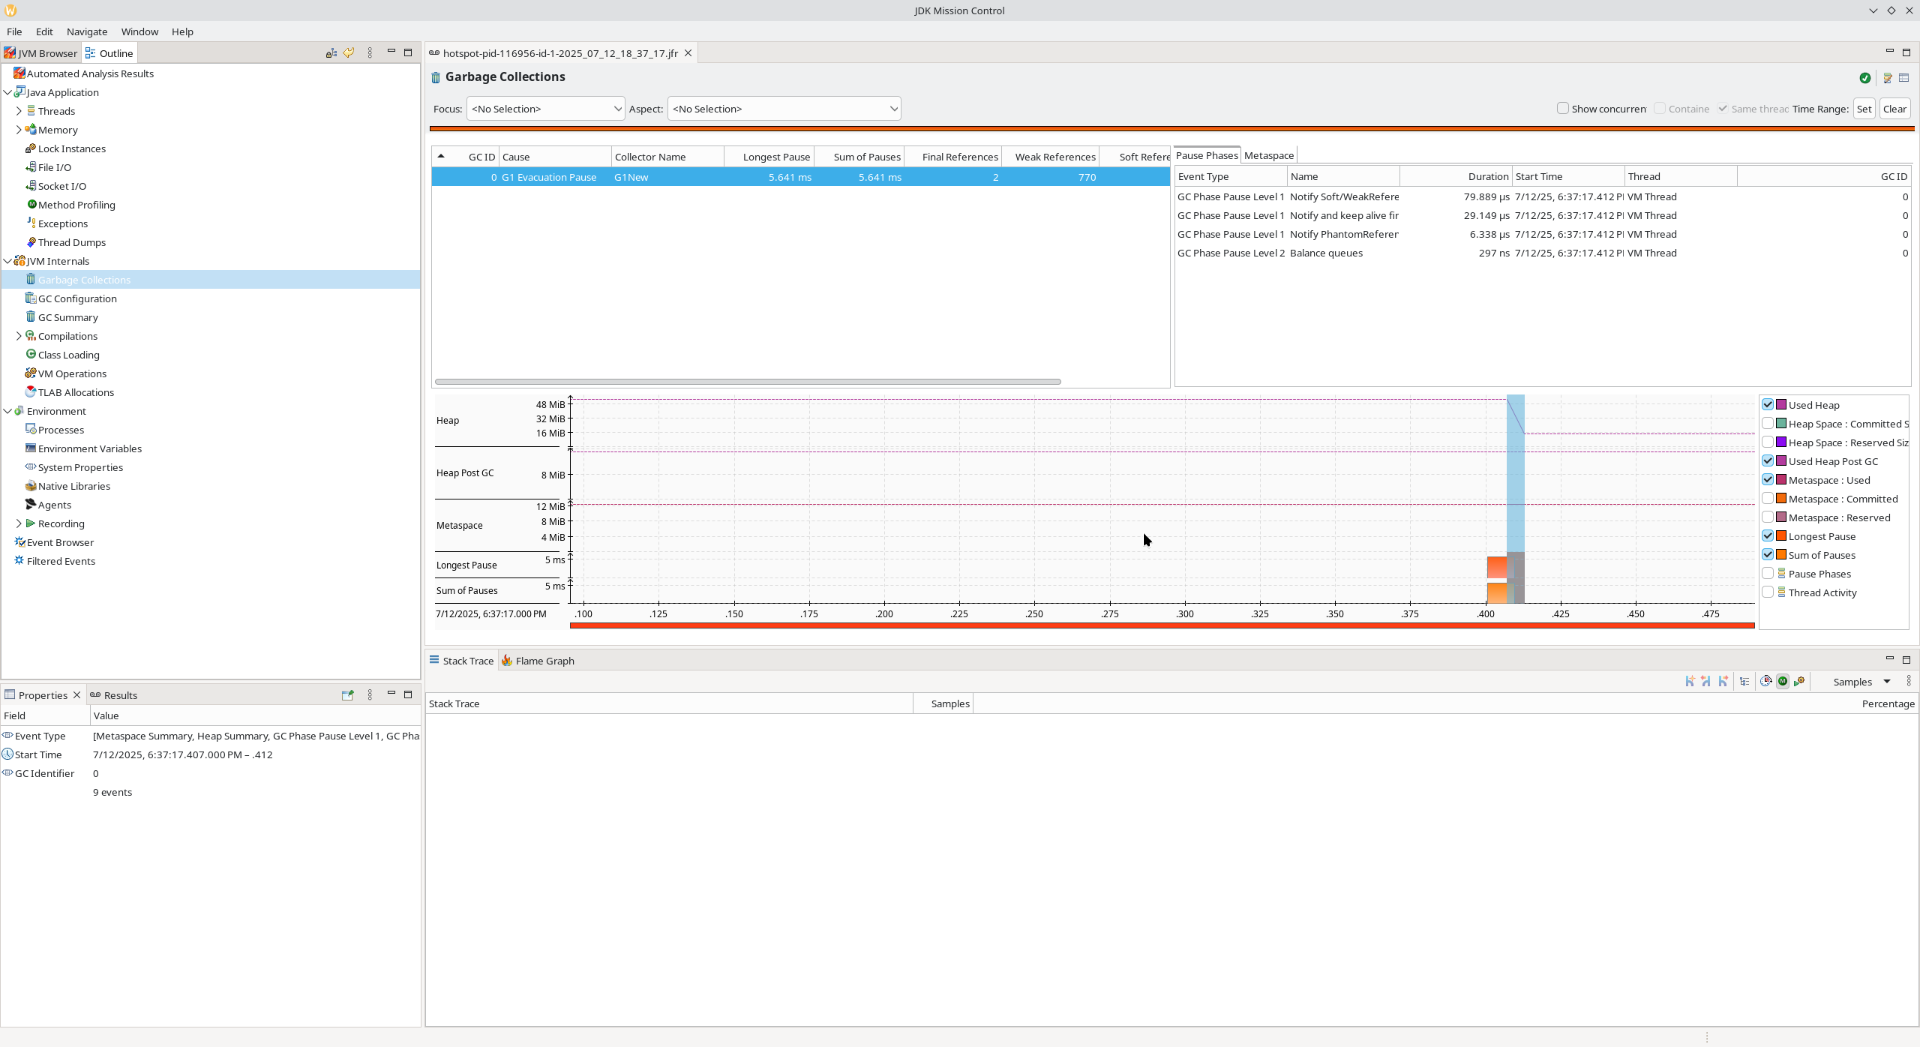
One GUI tool that can be used to analyze JFR recordings is JDK Mission Control (JMC). This tool can open JFR files and display information about the events.
To fire custom JFR events in an application, the application can create classes for these events by extending
jdk.jfr.Event.
These events can be given a name, category and description using annotations as well as additional information using fields.
These events can be created like any other Java objects and can be sent to JFR by calling the commit() method. As JFR events can have a start time and a duration, the begin() method can be used to tell the JDK when the event starts:
📖 Sample answer from dan1st
A performance monitoring and profiling tool built into the Java Virtual Machine (JVM).
• Used by developers to collect diagnostic and profiling data about a running Java application.
• Helps identify performance issues like memory leaks, CPU bottlenecks, or thread contention.
• You can record data and analyze it later with tools like JDK Mission Control.
Submission from karlas1.
a tool for collecting diagnostic and profiling data about a running Java application
Submission from 1java.
JDK Flight Recorder (JFR) is a powerful profiling and monitoring tool built directly into the Java Virtual Machine. It continuously records detailed information about what's happening in your JVM with minimal performance overhead, unlike other profiling tools such as JProfiler.
JFR was initially made by Oracle as part of their commerical JDK Toolkit, but it was open-sourced and made available to everyone since OpenJDK 11.
Basic Usage:
You can enable JFR in mainly two ways:
CLI:
Programatically:
JFR employs a circular buffer system, you're able to either specify duration or file size, and if profiling data exceeds any, the old profiling infromation will be rewritten.
Working Mechanism:
JFR "records" events that occur within the JVM, which includes:
- Method profiling data
- Garbage Collection
- Thread Activity
- I/O and Memory Operations
- Lock contention
- JIT Compiler Activites.
These events are mainly of three types: Instant events, Duration Events and Sample events.
Custom Events:
JFR allows you to create and track your own application-specific data or metrics:
Analysis Tools:
JDK Mission Control (JMC) is the primary tool for analyzing JFR Recordings. It provides visual timeline of events, memory and cpu profiling data, recommendations and automated analysis, hot methods identification, etc..
You're also able to use the
jfr CLI tool to analyze JFR recordings:
JFR JVM Flags:
-XX:StartFlightRecording: Start JFR Recording:
Common Sub-flags:
delay=<time>: Specifies the delay between JVM launch and recording start.
duration=<time>: Sets how long the recording should run, 0s means forever.
filename=<path/name.jfr>: Specifies the output file name for the recording, defaults to system-generated name with PID and timestamp.
disk={true/false}: Whether recording data is written to disk during recording.
dumponexit={true/false}: Automatically dumps the recording when JVM shuts down.Practical Templates:
Production Monitoring:
Memory Analysis:
Continuous Recording:
⭐ Submission from daysling
other correct answers:
correct answer by
NebulaKnight👑:JFR (Java Flight Recorder) is a profiling and event collection framework built into the Java Virtual Machine (JVM) that helps in diagnosing performance issues, analyzing application behavior, and troubleshooting crashes with minimal overhead.
Key Features of JFR:
. Low Overhead: Designed to have minimal performance impact.
. Event Collection: Captures JVM and application-level events.
. Continuous Recording: Can run continuously in production environments.
. Integration with JDK Tools: Works with jcmd and Java Mission Control (JMC) for analysis.
correct answer by
Rick:JFR (JDK Flight Recorder) is a built-in tool in Java that records everything your app does — like CPU usage, memory, threads, and errors — so you can analyze and debug performance issues later. It's super lightweight and runs even in production, like a "black box" for your Java application.