Akira: Ghosts in KS2 .. spooky...
Hi,
So little bit of an issue. Using endpoints so far has been relatively OK.
As far as GPU allocation goes it seems fair. But the worker load is another thing all together. Mostly my generations happen at about 1.3it/s ... but then it will jump same worker, similar task ... 35s/it!
I'm honestly a little impressed that you've managed to keep your Datacenter/s from burning down.
I honestly wouldn't care all that much except for the ... sometimes horrific per second charging. Doesn't seem all that fair if it's the workers CPU that is causing issues.
I don't mind paying 3-4c for an image generation.... we even eat the cost of pipeline rebuilds ... But charging over $1 for an image because your worker can barely get enough CPU time? Little bit sh*t.
(Not to mention the generations that timeout! Yep that's right a task that takes usually 35s max gets killed by the 10 MINUTE pod timeout. )
24 Replies
It's pretty hard for us to over allocate, we give users one GPU out of the few (no more than 8) installed to the server physically. I'm happy to look at your workload and understand what happened, it's possible the GPU you assigned may not have enough CPU cores assigned alongside of it? I can take a look with a Serverless Endpoint ID or a Worker ID
@Dj There was a few last night ... it appears timeouts don't show up in the logs ... or my eyes might be missing them but here's a few that failed for no particular reason. (I trashed a few workers that where failing constantly also)
yrnbbz9ao8fyr1[error]Failed to return job results. | 400, message='Bad Request', url='https://api.runpod.ai/v2/lr28ehx90t610b/job-done/yrnbbz9ao8fyr1/c0375e1b-51ad-4ba2-853e-6e95176a3b99-u1?gpu=NVIDIA+H100+PCIe&isStream=false'
gf2r3u9rlpzitr[info]connectionpool.py :871 2025-07-14 18:05:55,227 Retrying (Retry(total=2, connect=None, read=None, redirect=None, status=None)) after connection broken by 'ReadTimeoutError("HTTPSConnectionPool(host='api.runpod.ai', port=443): Read timed out. (read timeout=8)")': /v2/lr28ehx90t610b/ping/gf2r3u9rlpzitr?gpu=NVIDIA+A100-SXM4-80GB&job_id=sync-838ca281-b37f-4aa6-a81c-e086a7af51e6-u2&runpod_version=1.7.12\n
@Dj It does appear to be CPU related ... sometimes the workers will come thru with only 16 vcore. And they sit at 100% for an entire 5 mins if lucky or over 10 if not.
You don't have to ping me twice I promise 🙏 - Checking now, I'm just also running a browser test so I have tabs opening and closing lol
All good .. been at this for over 72 hours... was supposed to have this running this week ... the project went from bare metal to a serverless hybrid. Most stuff I'm typing is a mystery to science ... i.e soz didn't mean to ping again... auto pilot.
I want to check a couple things for you, give me a minute
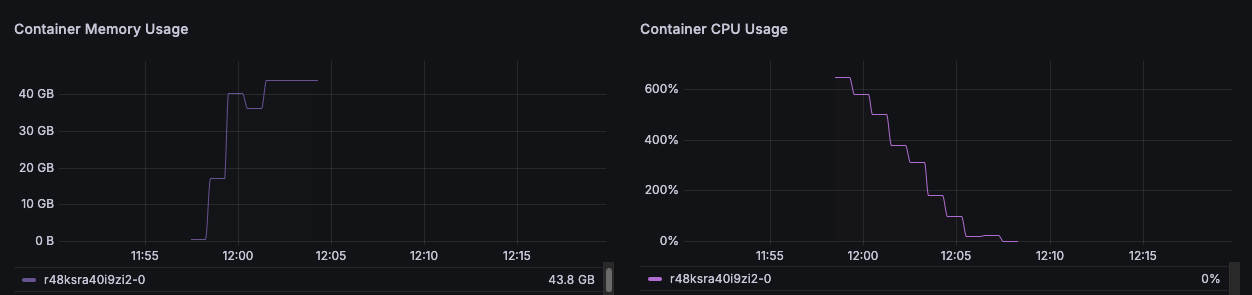
This job ran with 16 vCPUs and choked itself out.

I can see the same here
Sorry this is taking me an awfully long time, I managed to find a bug in our Grafana and it makes filtering really hard
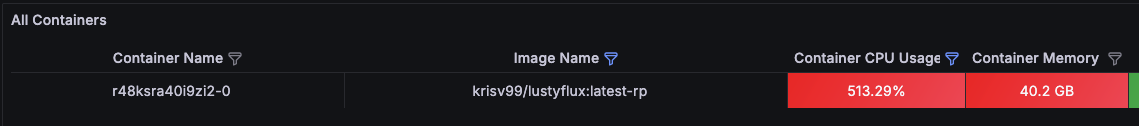
woot 513% that's cool 🙂
yeah ... half the issue is I'm stuck at KS1 due to volume limitations.
Wish I could be somewhere witha cleaner GPU queue
I can see the issue a lot better, I had to ask someone to fix some dashboards for me :blobextranervous:
I think your jobs that're going well are running on H100 PCIe devices, A100-SXM4's and the L40s they have a higher average vCPU per GPU count.
I think your job is weirdly CPU bound - saying this, I want to verify you're actually using the GPU at all and just the lower vCPU per GPU in this datacenter in particular are screwing you. Over alloc isn't fair of a title, like I figured before I just think this DC may need a little modernization.
Well it is my own pipeline. But it's fully mapped to cuda ... I see the cards vram loading up and then gpu lights up for inf. (not sure about in the wild but it sure makes my 4090 fans sing)
Yeah. I can see the GPU lighting up, it just took a lot of isolating - in the main dashboard of "show me this GPU during this time" it's a lot of clicks to view one specific job.
The spike here would be this random pod from your account (same endpoint) spinning up
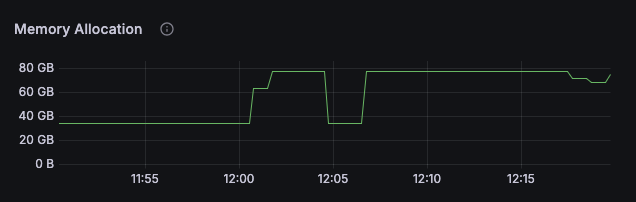
What I notice along side it is this
but also I saw 100% and a thrashing cpu sometime .. on the Telemetry panel .. (I know its prob only for show)
It's only a lorafield flux pipe ... 99% it spits out an image in under 10secs .. just get these wierd timeouts occassionally
But the point is 2-3 10 minute timeout an hour ... does affect ones budget a little...
Yeah ... it's just strange if it happened every job I'd rewrite the whole worker... but due to it being 2 out of 30?
Like now .. one pipeline build and 3 cached runs ... not an issue ...
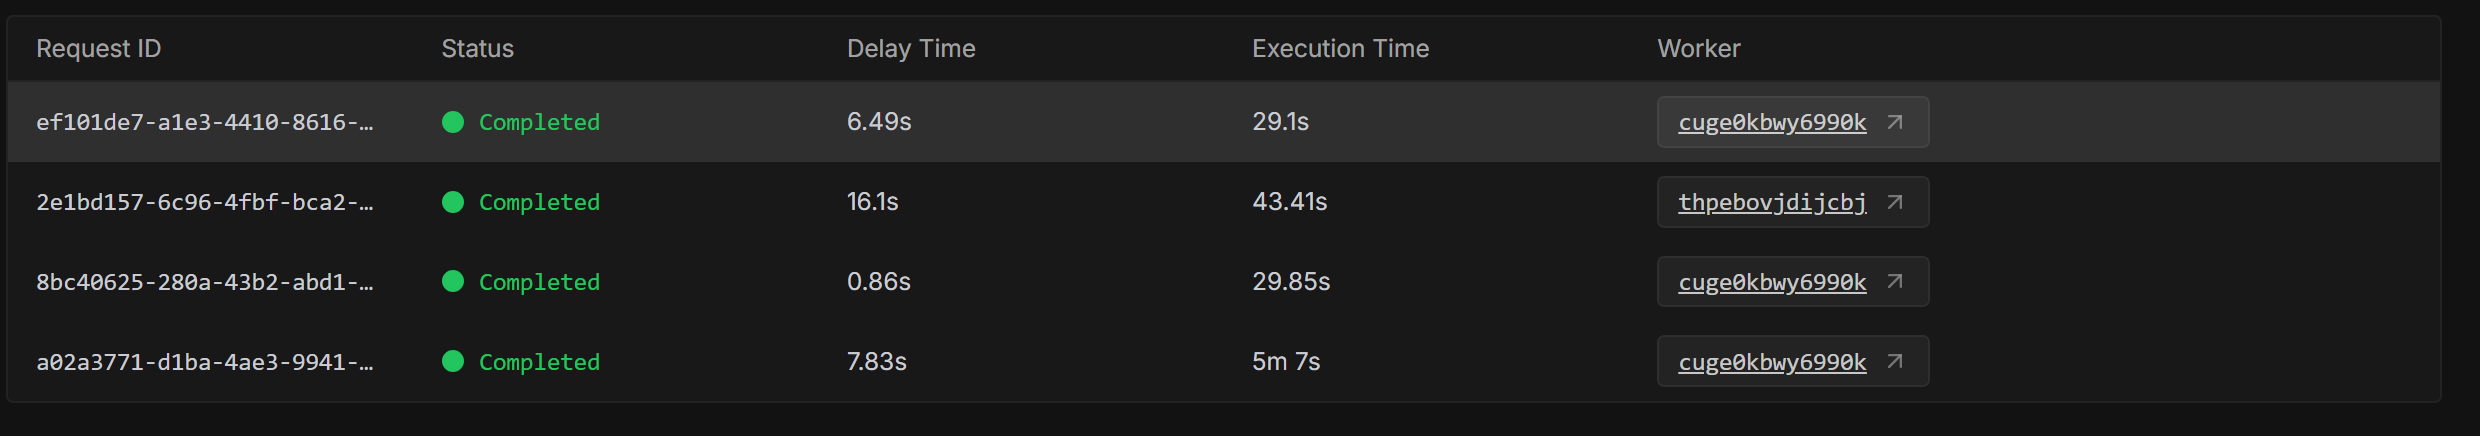
@Dj Then bam out of the blue: 3min pipeline load ... all the other workers picking the cache and running beautifully
model_loader.py :29 2025-07-15 19:56:11,254 Loading FluxPipeline with fine-tuned UNet
2025-07-15T19:59:51.460298007Z
Loading pipeline components...: 100%|██████████| 7/7 [00:04<00:00, 1.20it/s]
Loading pipeline components...: 100%|██████████| 7/7 [00:04<00:00, 1.57it/s]
That's one expensive picture...
You're right .. possible bad title.
@Dj So just curious now, We confirmed that a few workers where in fact "overworking" (500%) duty cycle
We confirmed that it's not the code. or it would be happening on every job.
We confirmed that this causes extremely expensive generations that I probably shouldn't be paying for.
Is there any followup? 🤔
I think there's a little value in considering what you can do (if anything?) to take the load off the CPU, but I wouldn't have any followup steps aside from being able to help recommend a new DC location if you could tell me your requirements (I'm aware of Network Storage, for example) and optionally I can calculate a good amount to be able to refund you in credits for helping with the debug/your lost time (both!)
Actually ... fttb I've moved from using storage to just consuming /workspace there just doesn't seem to be a combination of perm storage and GPU that can access each other.
So long as the Pod is being started with the Network Storage drive connected (and it is attached to /workspace not somewhere custom like /runpod) you should be okay?
wait is the container storage /workspace? I was using /runpod-volume for the attached mount.
currently I use /workspace in my dockerfile... that's the container temp non-perm disk?
or all basically / if you want to be literal
Container Disk
Temporary disk space for the container
:ablobnod:
The container storage is if we spawn a Pod for you, you get N amount of ephemeral data. Maybe your workload idk renders a video and you need somewhere to store it. This storage is significantly faster than the alternative:
Volume Disk
Which we market as Network Storage, it's a network drive mounted on /workspace by default.