S
Supabase2mo ago
A

Supabase Intermittently Stops Working.

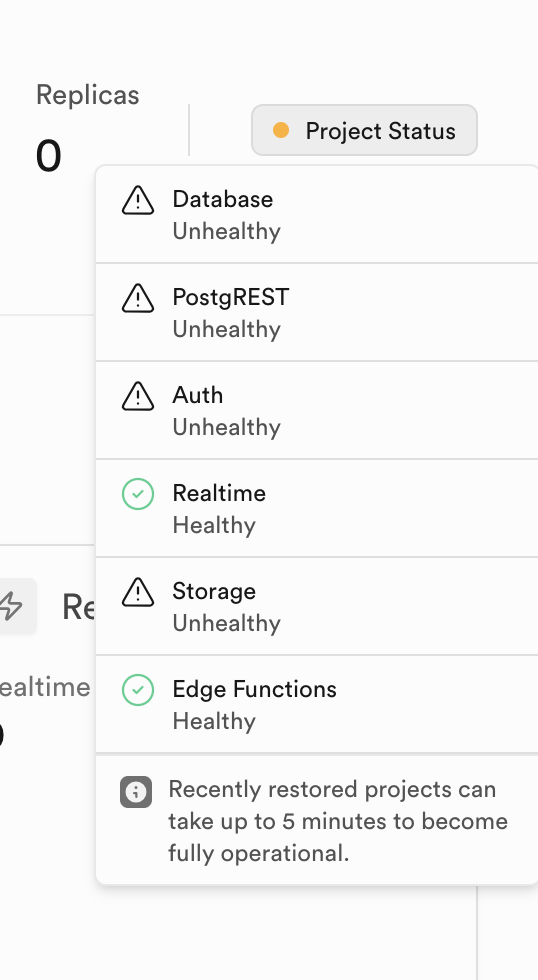
My project has been healthy and been active for months. Starting 2 days ago it's been intermittently becoming unresponsive and my frontend app API calls timeout. My project status shows that it's unhealthy. I've seen everything from Max CPU and Disk/I/O to timeouts. I've been optimizing queries and indexes to help. I've even vaccuumed some tables just in case. Opened two tickets with supabase support, but yet to hear back. My front-end traffic has been steady, but now my customers are getting pissed. Anyone experienced this and maybe solved it?
No description
13 Replies
garyaustin
garyaustin2mo ago
Probably going to take support looking at it. Did you get the auto reply at least from your support request? Do your logs give you any useful info? CPU/Disk charts? Query performance tables?
A
AOP2mo ago
I got the automated email, but yet to hear from them. I just sent them an email. I'm watching all the logs and have done some optimizations on some queries, but it's becoming clearer and clearer that it's likely something outside my project causing this.
A
AOP2mo ago
And now getting this even though I don't see any burst in traffic
No description
garyaustin
garyaustin2mo ago
Did you look to see if a large number of queries are being run in the Query performance tab?
A
AOP2mo ago
Not much screaming out here. Slowest query is 892ms and it's not even from my app code. Seems like supabase system queries.
No description
garyaustin
garyaustin2mo ago
Your most frequent does not look very high either but check that.
A
AOP2mo ago
The most frequent again are supabase controlled queries and taking negligible time. All the more why I feel it's something in the wider supabase platform. No mention of incidents affecting this so far. Weird
No description
garyaustin
garyaustin2mo ago
Unless the AWS server you are on is having issues... Those queries are not going to cause an issue assuming that is not a few minute trace. Also when you overload the database you would normally start getting timeout errors and not the services shutting down.
A
AOP2mo ago
Thanks. I guess I'll wait to hear from supabase support and keep looking/trying things in the meantime. Thanks for your responses
garyaustin
garyaustin2mo ago
I noticed another user mention cron running on a thread you commented on. Do you have any cron tasks?
A
AOP2mo ago
Yes I do and I've disabled all the non-critical ones to see if it helps. Actually I looked at the cron tables and they don't have indexes. I wanted to add a couple of indexes, but got an error because I guess the cron schema is managed by supabase. Anyways, I'll keep looking around as I wait. Thanks
garyaustin
garyaustin2mo ago
How fast are they running? Do you prune the cron run details table? It can grow very big and slow if not cleaned. https://github.com/citusdata/pg_cron?tab=readme-ov-file#viewing-job-run-details
A
AOP2mo ago
Thanks. I already have a job to clean up cron.job_run_detailss a few times a day. Update: Took a couple of days for Supabase support to get in touch, but when they did they were helpful. I wish they could provide phone support. In my case there were a number of issues that contributed: 1. My cron jobs table had grown so big that the inserts were taking longer and longer. It also didn't help that the cron.jobs_run_details table doesn't have covering indexes. I've suggested to supabase if they could add at least two indexes and I'll wait to hear back. Deleting older job records helped, but not before contributing to high disk IO / Disk IO budget depletion. 2. We've since added a scheduled job to clean up older cron job run details periodically. 3. We had one cron job that was not running efficiently and supabase support helped us identify it based on EBS IO Balance charts they shared. We've since optimized queries and added covering indexes. So far so good and we will keep observing. 4. The issue for us was that due to a large cron jobs table and some inefficent queries, the disk IO budget was getting maxed out, CPU was getting maxed out and swap memory usage was increasing. 5. Lastly, there is no easy way to really accurately see how your actual disk IO usage compares with the EBS IO budget. The built-in supabase reports/dashboards showed us to be be well away from the limit even with some spikes, but supabase support has access to the underlying EBS IO balance and able to plot when the budget was running out. It would be great if this EBS IO budget could be made readily available in the built-in reports. 6. Consider adding Grafana to your monitoring (it helped us see the high swap usage) Overall, thanks for your support and hopefully this helps someone in the future.

Did you find this page helpful?