Heap profiling with wrangler dev?
I'm trying to optimize our websocket message handler in a Durable Object that receives a lot of messages. I'm interested in figuring out how much garbage it generates over time before and after my optimizations, but am having trouble profiling with workerd.
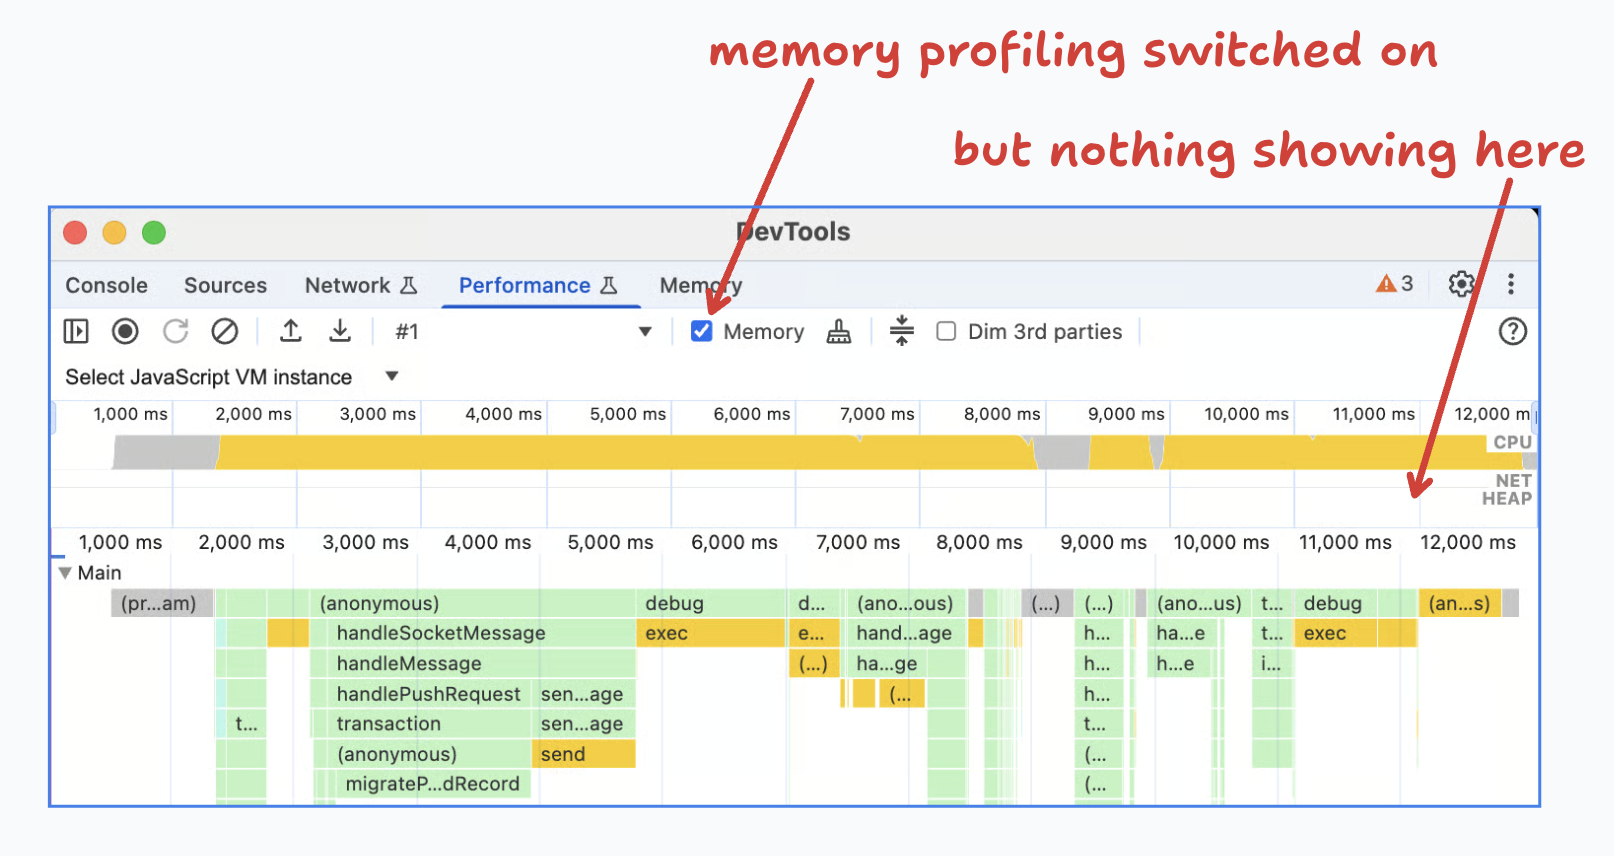
It seems like with the built-in profiler, even if you have the 'memory' checkbox toggled, the heap trace is blank.
Anybody know if there's some config I can switch to make this work or if there's some other way to profile heap usage over time?
It seems like with the built-in profiler, even if you have the 'memory' checkbox toggled, the heap trace is blank.
Anybody know if there's some config I can switch to make this work or if there's some other way to profile heap usage over time?

Welcome to the official Cloudflare Developers server. Here you can ask for help and stay updated with the latest news
87,353Members
Resources
Similar Threads
Was this page helpful?