Is my caddy setup missing anything?
Hey again,
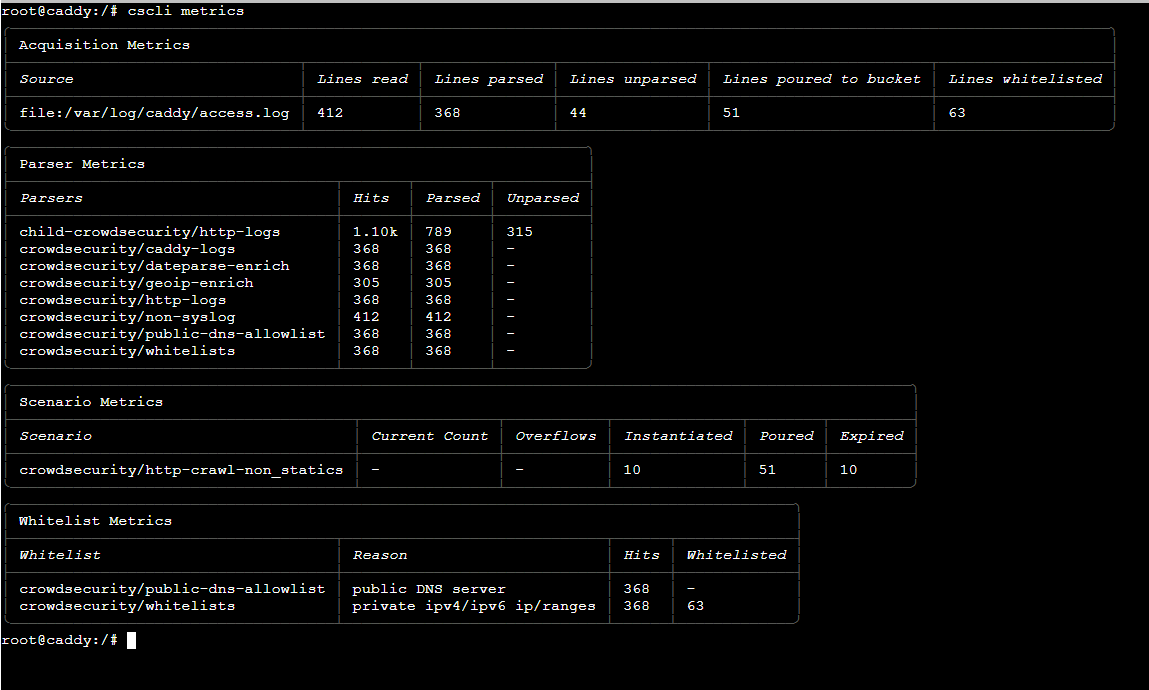
When running cscli metrics I can't see any scenario metrics while on my other machines it works just fine.
is this a normal behavior?
I know that caddy bouncer don't have metrics atm, is this why its emtpy?

25 Replies
Important Information
Thank you for getting in touch with your support request. To expedite a swift resolution, could you kindly provide the following information? Rest assured, we will respond promptly, and we greatly appreciate your patience. While you wait, please check the links below to see if this issue has been previously addressed. If you have managed to resolve it, please use run the command
/resolve or press the green resolve button below.Log Files
If you possess any log files that you believe could be beneficial, please include them at this time. By default, CrowdSec logs to /var/log/, where you will discover a corresponding log file for each component.
Guide Followed (CrowdSec Official)
If you have diligently followed one of our guides and hit a roadblock, please share the guide with us. This will help us assess if any adjustments are necessary to assist you further.
Screenshots
Please forward any screenshots depicting errors you encounter. Your visuals will provide us with a clear view of the issues you are facing.
© Created By WhyAydan for CrowdSec ❤️
I had my test traefik running for a day and its showing a lot of metrics for different scenarios,

No metrics has no impact on what scenarios match.
Most likely the 300 requests have not matched any other scenarios than http crawl non statics.
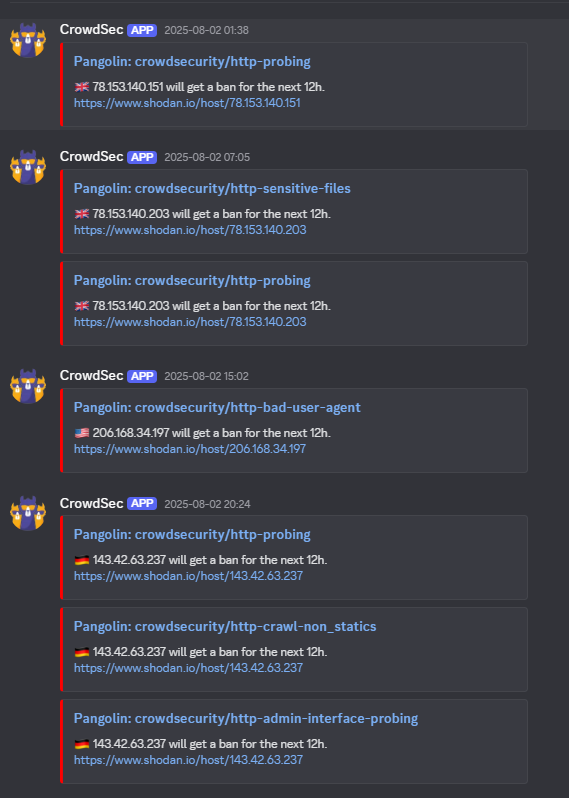
the reason im asking is because I been running caddy wiht crowdsec for months, but after 3 days with traefik im getting multiple bans. That's why im curious if my configuration is wrong with caddy 😅

I had the same kind of bans running crowdsec on npmplus, but not on caddy since i switched
Any idea? 🙂
no idea without anymore information from what I see, you only got 700 requests and its a rather small set to come to conclusion that something wrong.
try running explain, try see if you have all scenarios installed etc etc
Yes, all collections and scenarios are identical. No idea why it’s acting that way 🤷🏽♂️
I went over to Npmplus, after 4 hours i got some bans and scenarios,

I think the caddy bouncer can't pars the logs
well bouncers dont parse logs, the engine does
sorry. then something else is wrong with my setup on caddy 😅 we can leave it if you don't wanna troubleshoot it
I rechecked the caddy parser just to see if we missed anything, and everything lines up with the scenarios
thank you for the help as always 🙏🏽
its not that I dont want to debug it, your just not providing any information to debug
cscli metrics only shows limited information, you need to run cscli explain or put the acquisition into debug mode so we can see more informationLike this?
cscli explain --file /var/log/caddy/access.log --type caddy
Personally just so we dont have to filter it just do this
then just DM me the
/tmp/caddy.debug.logsure, thank you
you want crowdsec.log and crowdsec-api.log as well?
nah just the explain for now
oki, its taking some time generate the file, i'll dm it to you when its done, thanks again
my container died with 8 gb ram and 4 cores, let me try that again xD
is there any way I can make the log file smaller?
Try
tail /var/log/caddy/access.log | head -n 20 | cscli explain -f- --type caddy -v 2>&1 > /tmp/caddy.debug.log to get only 20 lines of the logfile.
Change the number to anything your system can handleHmm, i get some warnings and the log file gets like 15kb only
Ignore the warning for now.
Like it says: The pearser didn't fill evt.StrTime on lines 1 and 2. These 2 lines would be useless in time-machine/forensic mode.
as for the size: It's a txt file - don't expect it to be huge... depends on how many lines your parsing.
Try increasing the head -n to 100 - cscli explain will take longer and use more resources.
my caddy.log is 26k, I picked 10k , seems to small to me for being a txt file 🤷🏽♂️
Ill try another way 😄 thanks!!
so checking through your logs, everything seems fine, the only thing to point out is you have a lot of requests from internal ips like promox and uptime-kuma, so is caddy the only proxy you have or is it a chain of proxies?
No its the only proxy I have. But I moved on to npmplus for a while now. Thank you for all the help