Self-Hosted Supabase constant 100% CPU usage
Hello,
I’ve been testing Supabase as a replacement for another self-hosted BaaS. I set it up on my VPS (8 vCPU cores, 24GB RAM) using Docker, following the official documentation.
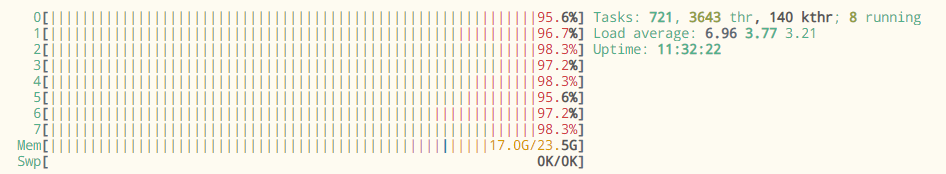
Everything runs without errors, but I noticed that all CPU cores stay at 100% usage constantly. It’s been several hours since starting Supabase, and the CPU load hasn’t gone down.
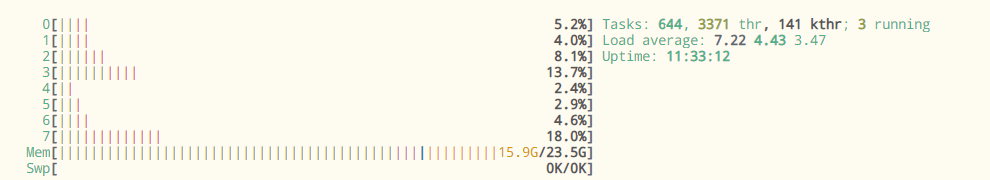
When I stop the containers with
docker compose down
, CPU usage immediately returns to normal (around 9% per core, since I run other services on the VPS as well). So it seems the issue is directly related to Supabase.
This also happens on a completely clean install, with no data or configuration changes. As soon as I run docker compose up
, the CPU usage spikes to 100% across all cores and stays there.
Does anyone know what might be causing this or how to fix it?
I'm attaching images of htop before and after shutting down the Supabase containers.

50 Replies
have you checked which container in particular is causing this spike
I've checked it using
docker compose stats
and it was at most pg-vector, which was consuming about 20% of the CPU and studio was also consuming about 15%. The rest was about 1%.
One more thing that comes to mind is the analytics container which is spamming, like literally spamming (can't even read it at that speed) messages such as these:
And are all containers healthy?
They are like this:
Seems like the auth, pooler and storage keep restarting all the time
The only error im getting is this one:
Error response from daemon: driver failed programming external connectivity on endpoint supabase-kong (6d71a393544089d8442c07b07ad2073f8ef27297c1cecfd41a69d38c77496b39): failed to bind port 0.0.0.0:8444/tcp: Error starting userland proxy: listen tcp4 0.0.0.0:8444: bind: address already in use
Which is rather weird because nothing is running on that port except for the Kong itself. Even if I docker compose down
containers and up again then I'll get this kong error for some reason.
I technically probably don't even need Kong as I use nginx reverse proxy, but I wanted to stick to the original without modifying much stuff.
storage keeps giving me this error from docker logs:
These containers not healthy is the reason you're getting all those spammy type messages in analytics logs.
The issue I believe is the db password
there are special characters
And I think that is also what causes the cpu spikes
You can generate password using
openssl rand -hex 16
I assume you don't have any data in this instance? If yes, then after updating the db password in .env file, run this command rm -r volumes/db/data
and then run docker compose up -d --force-recreate
Could be the reason.alright, will try it out
alright, I've completely reinstalled supabase, recreated db and this is what I got:
all containers are fine (and yes, the encryption key was the issue for pooler)
now the issue seems to be the analytics container
as it seems to be spamming something like this
and the vector spams this:
Its hard to read this output. Send me the output of this command
The issue is in realtime
analytics is healthy
these are the logs
After cloning repo, which env variables did you update?
most of the ports, I also had to change analytics port in the docker-compose as it's already used on my machine
No, the env variables in .env file.
I think I might have changed some internal ports, that might be the problem
Are you using the default ones? By simply copying .env.example
no, I'm not as some of them are used already by other processes
How did you generate the
JWT_SECRET
, ANON_KEY
and SERVICE_ROLE_KEY
?I've generated the VAULT_ENC_KEY using the command you've sent me and the rest just by using random string gen
That command was for db password.
What about this?
just random strings
no specific command
This must be causing issues. These have to jwts. You create a random jwt secret and use that secret to mint jwts
ANON_KEY and SERVICE_ROLE_KEY are jwts
Try this first, take down all containers and use the default .env.example file to start the stack
Then, check if all containers are healthy and see your cpu usage
damn, I wish this was documented, because from what I thought you should be able to run supabase without touching .env at first
You can, with the default envs
Also in the guide there is a generator for secret and keys
https://supabase.com/docs/guides/self-hosting/docker#securing-your-services
I see
First try with the default ones
Make sure to run the
rm -r volumes/db/data
command before recreating the stack
this is important
cp .env.example .env
seems to be working 🎉
however the CPU issue still persists, unfortunately

Wait for some minutes, its expected at the beginning
it still persists
twose two just keep spamming logs messages
(still the same)
I honestly have no idea how this alone can add up to have 100% on all cores, but it somehow does
and when I shut these containers down it's back to normal levels, about ~10% a core again
This is on an ec2 instance

before

after

I'll check it out
anyway, thank you so much for your help, I appreciate what you're doing here
No problem. I'll be out for about 2 hours. Will get back to you later. If the solution mentioned in the forum doesn't work, install supabase cli on your server and run supabase start. See if that solves this issue. cli shouldn't be used for production environment. This is just for testing. Also make sure you're running the latest version of docker on your server.
So, it helped a bit (quite a bit), we're down to an average of about 85% a CPU but I've noticed this:
docker stats --no-stream --format "table {{.Container}}\t{{.Name}}\t{{.CPUPerc}}" | sort -k3 -r -n
gives:
and I've also noticed the following by running the top
command:
after shutting down the supabase containers:
(top 4 in top
)
(top 4)
I've found this reddit post: https://www.reddit.com/r/Supabase/comments/1cm385l/new_selfhosted_subabase_vector_instance_high_cpu/
Is the supabase-vector needed?
I would personally simply remove the container as I don't plan on using any AI oriented stuff or vectors in the database, but I'm afraid whether it will break any other functionality.
the name vector can be misleading. its actually a log aggregator and forwards logs to analytics service. You can disable it if you like. But I'd only recommend that you do it if you're not going to going to expose supabase stack to internet and have your own servers in front of supabase
well I'm already having nginx reverse proxy set up in front of the supabase and since supabase has its client sdk then restricting access to lcoalhost only servers wouldn't really be good
I just don't understand why it consumes so much CPU, especially if people can run it machines with fewer CPUs, there's gotta be some bug
Can you try it on a new server for testing purposes? I've deployed the stack in about 15 production environments so far and have never faced this issue.
Interesting but why did other people have the same issue as well?
I've also seen some other posts on the discord here talking about this but they never received an answer
There was one I believe last month. They were deploying on Digital ocean droplet but the issue got resolved after they went with the 1 click setup provided by DO. This could be a cpu specific issue. The self-hosted vector service is still at 0.28.1, but the vector github repo is at 0.49.0
so what do you suggest me to do?
Try on a new server
In the forum link I sent, there was also a comment about logs being too large and setting up rotation. I notice that you've other containers running as well. Did you try setting up log rotation config in daemon.json file?
nope but I will try it out now
it didn't help, I guess I might try to use other BaaS then unfortunately
Can you test on another server? I just want to rule out any instance issues
I'll see what I can do