Grafana Dashboards showing no data for many panels
I just setup the Prometheus export (
level = "full") and setup a couple of Grafana dashboards from here: https://github.com/crowdsecurity/grafana-dashboards
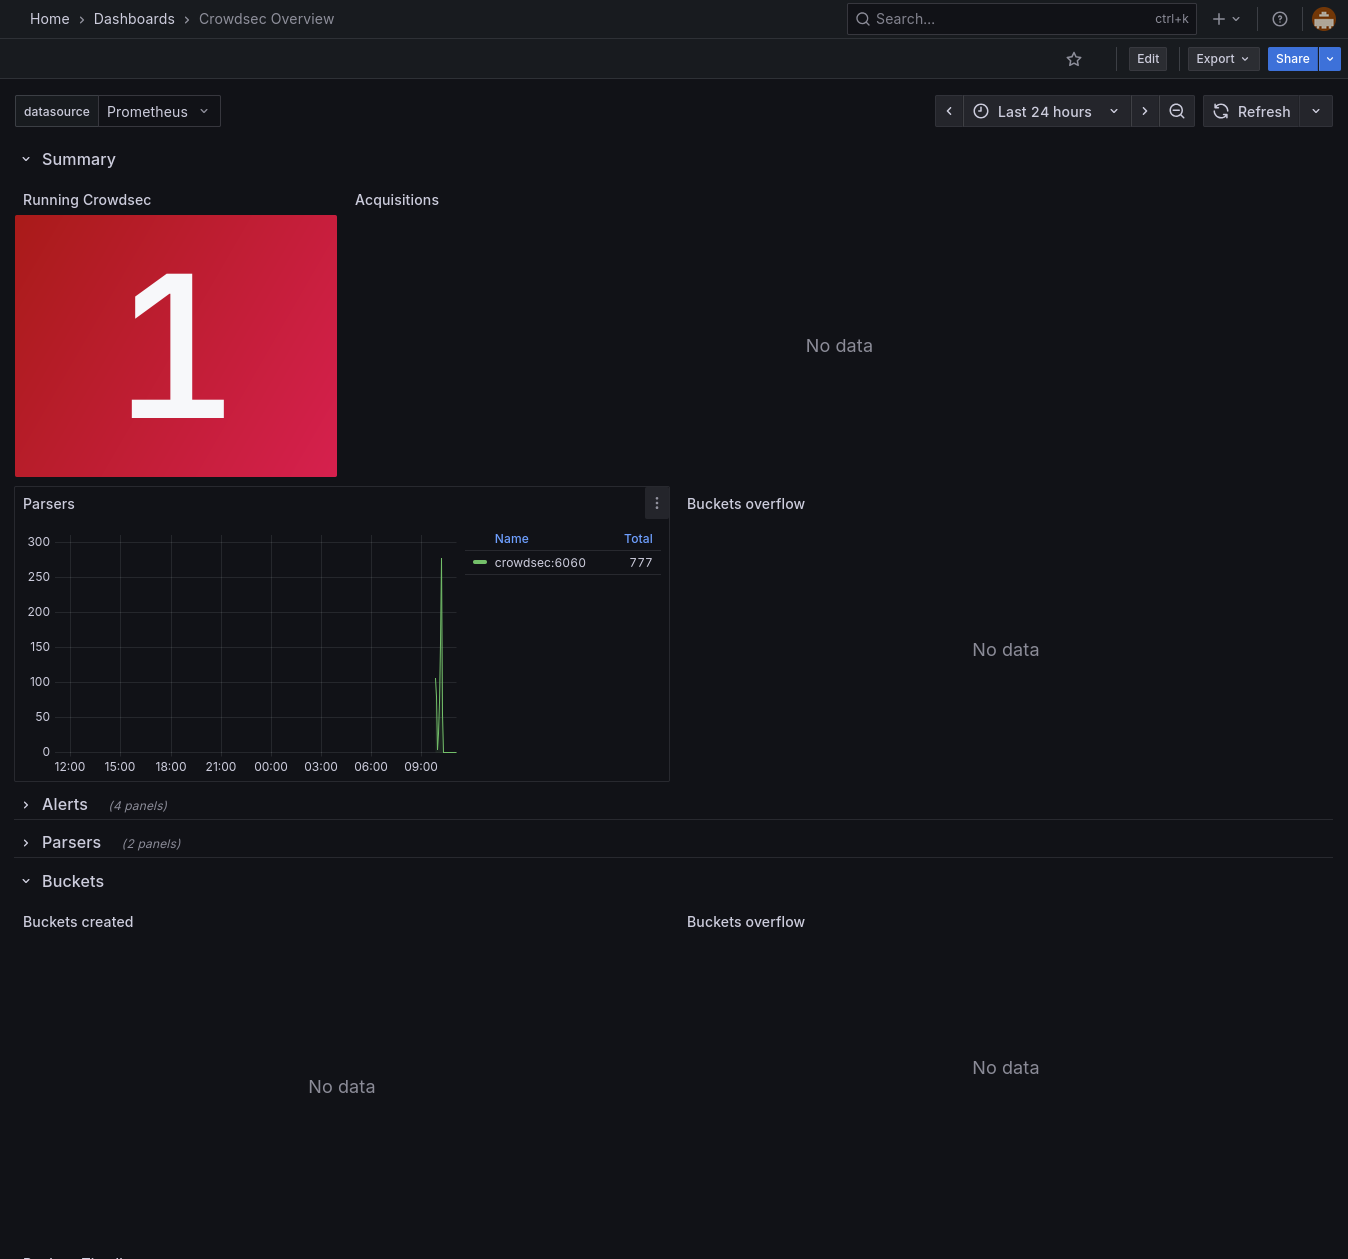
Now most of the panels have no data at all.
An example of the CrowdSec Overview panel is in the attachment.
Now even tho i still have almost none of my services exposed and low traffic, i would expect to see atleast some data for the Acquisitions, or the buckets.
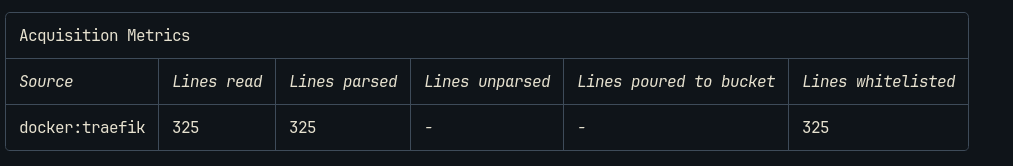
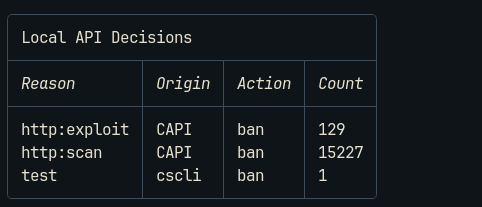
When running cscli metrics, i can see a couple decisions and acquisition metrics.
Are the Grafana dashboards just outdated (considering last update was 2 years ago) and not compatible anymore with the most recent version of Crowdsec? Or am i missing something?GitHub
GitHub - crowdsecurity/grafana-dashboards: Grafana dashboards for C...
Grafana dashboards for Crowdsec monitoring using Prometheus - crowdsecurity/grafana-dashboards
9 Replies
The other panels not showing data are based on detections, your current logs from Traefik have all been whitelisted so either they are from internal IPs or your using a upstream proxy like Cloudflare or Cloudflared and have not configured trusted headers so it cannot get the real IP of the request.
Interesting, so all whitelisted requests won't be counted in the metrics?
Well now that I look abit deeper, it should be in the acquisition section but.... maybe @blotus can chime in as he is original author
Whitelist should not impact this: for the acquisition, the metric is incremented when we read the log line, so no whitelist has been applied yet
Same goes for the parsing metric, it's incremented just before the we actually do the parsing, so no whitelist here either
The dashboards expect a
machine label in the metrics that should be added by prometheus:
Actually, for this dashboard, it shouldn't matter, we rely on the instance label that is automatically added by prometheus
oooh i know what's happening
Because of some not-very-wise design decisions a long time ago (way easier to implement, but harder to use), each datasource use a different metric name to track what has been read (cs_filesource_hits_total for the file datasource and cs_dockersource_hits_total for docker for example), and now we are kinda stuck with this.
At the moment, only those queries are defined in the dashboard:
So any other datasources we have added in the last 2 years or so are not shownmakes sense. with traefik logs being acquired from docker tho, shouldnt this datasource be shown alrdy?
no because the dashboard itself does not know about it.
You can edit the panel, and add the following query to it:
For the buckets:
- If you had no attack attempts, it's normal for the buckets overflow to be empty (you can check if you had any alerts with
cscli alerts list)
- The buckets created being empty, it's a bug: it's using the cs_bucket_created_total but this metric does not exist (I don't know if we removed it at some point or if it never existed). It should be cs_bucket_instantiation_total insteadAlright, thanks. I'll try to update the dashboards later and see how many panels i can get filled with some data 🙂
will you check the current status of the dashboards in general to fix those upstream too, or does it have a rather low prio atm?
THey will be fixed, not sure when, I need to find some time to do it
From a very quick look, the only issues seem to be I can see:
- missing datasources in the acquisition panel
- Multiple wrong references to
cs_bucket_created_total in 2 different dashboardssounds good, i'll check those out after work