Studio Schema Viz Customization
A quick question regarding the new Web base Studio (BTW, its great to be able to use TypeDB for learning with no install required!). I've created a small schema for a demo I'm doing in a few weeks to a potential client. I'm wondering is there any way to manipulate what appears in the Visualizer (its a nice improvement from v2). For example: 1) suppress the attributes to make it a bit more readable 2) show ONE selected entity with any other entities connected via a relation 3) maybe some other cool tricks you may have? Thanks!
26 Replies
@davidg , at this point in time i think we haven't planned more customizable schema visualizer, although i think the list pane in the query page is customizable to some degree so maybe it's not a huge amount of work @alex ?
Are the things you want to do expressible through TypeQL? Eg 1. not selecting the attributes you don't want to see, 2. Use a limit?
We could expose the visualised graph object and ask you to manipulate it yourself via the browser console. Ugly, but you can customise it as much as you want. We could document it with a couple of examples.
Else we'd be writing a few of the most common customisations and leaving it at that
how long's a piece of string @Joshua , there's 100 customisations that would be useful to have. any one is not too much work, but the more we have, the better the results
release-wise i'd love to see us add "schema visualiser customisation" as a PR that comes with a small suite of basic customisations
we have a wishlist in Github
Secondary goal: let the user write custom visualizations easily
actually i'd argue that's the primary goal in the age of AI
then users can generate their own Viz on the fly
Yeah I think you'll have two different use cases, people wanting to use Studio as a standalone product, and people wanting to use schema vis capabilities in their own apps
Don't have a read for which is more common right now
i think there's a lot of "Demo" cases where people want to show specific things. Studio can't possibly cater to everything so i think making it easy to build that yourself is a good goal
Tutorial time
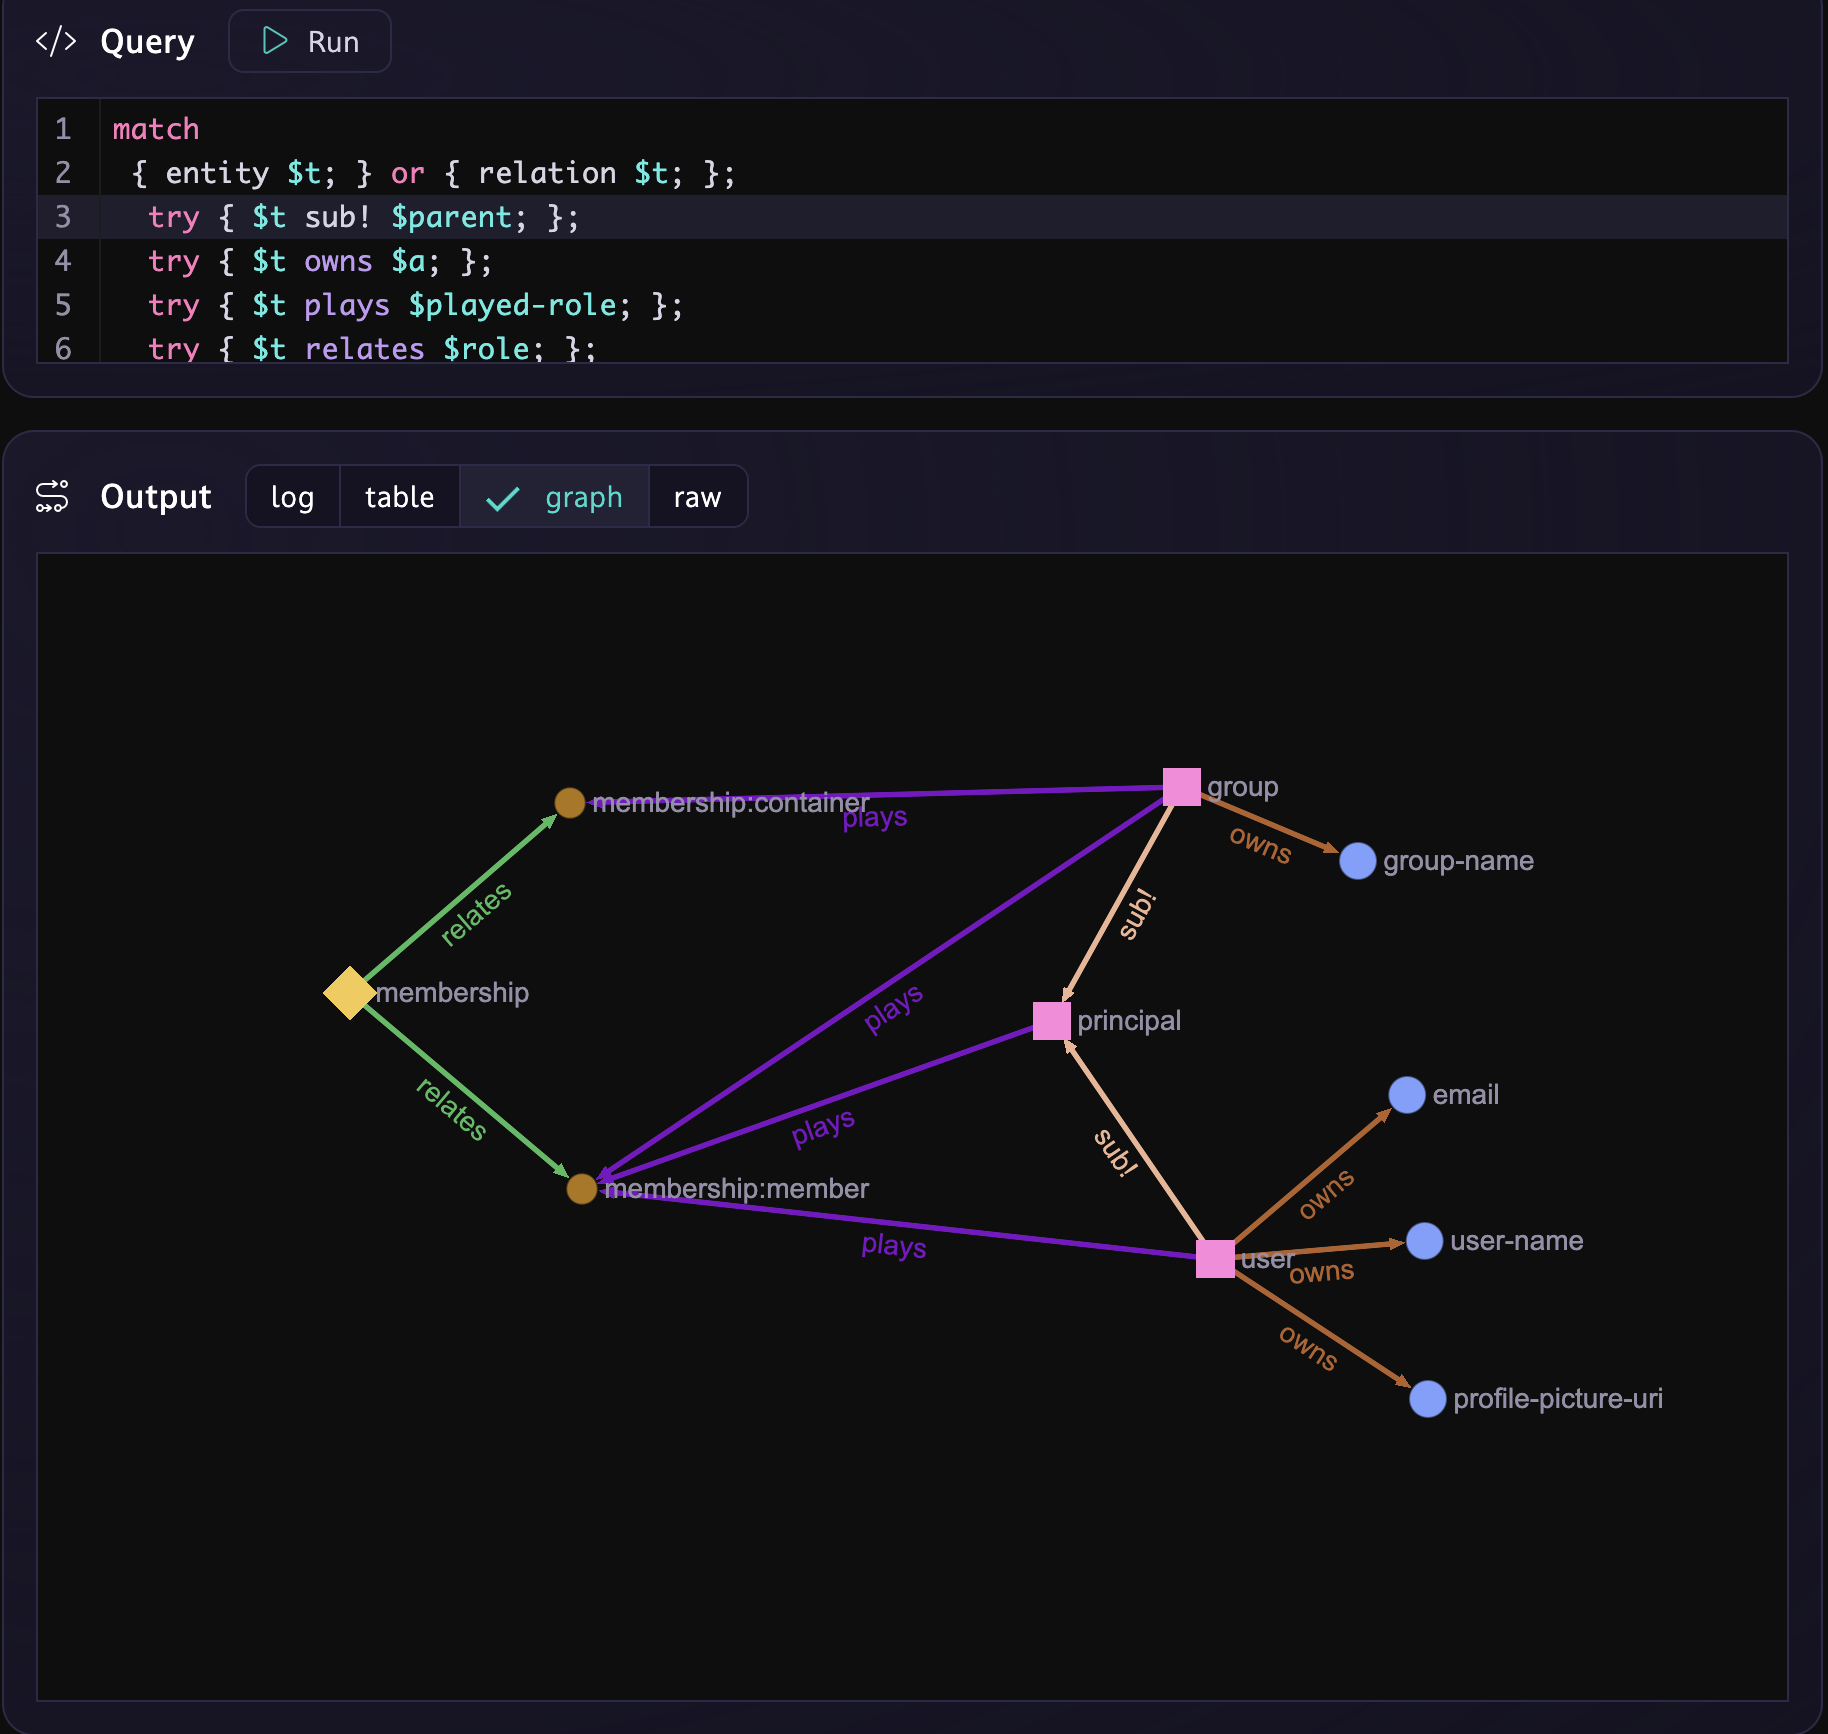
match {entity $t;} or {relation $t;}; is a query that retrieves the correct 'things' in the schema and I can see them in the log, table or raw output view, but the graph view is empty. The query does not affect what you see the schema visualizer.
that could be a bug, the nodes shoud turn up i think?
If someone could describe how to do that I'd give it a try!
so to be clear - you should be able to visualise schema using Queries -> Graph output in the Query pane
but you can't specialize it like that in the Schema pane
I've actually never seen anything appear in the graph output pane?
try some non-schema concepts? eg
match $x isa! $t;
oh hey
mine's broken too
looks like we must've broken it in the last release or something :?
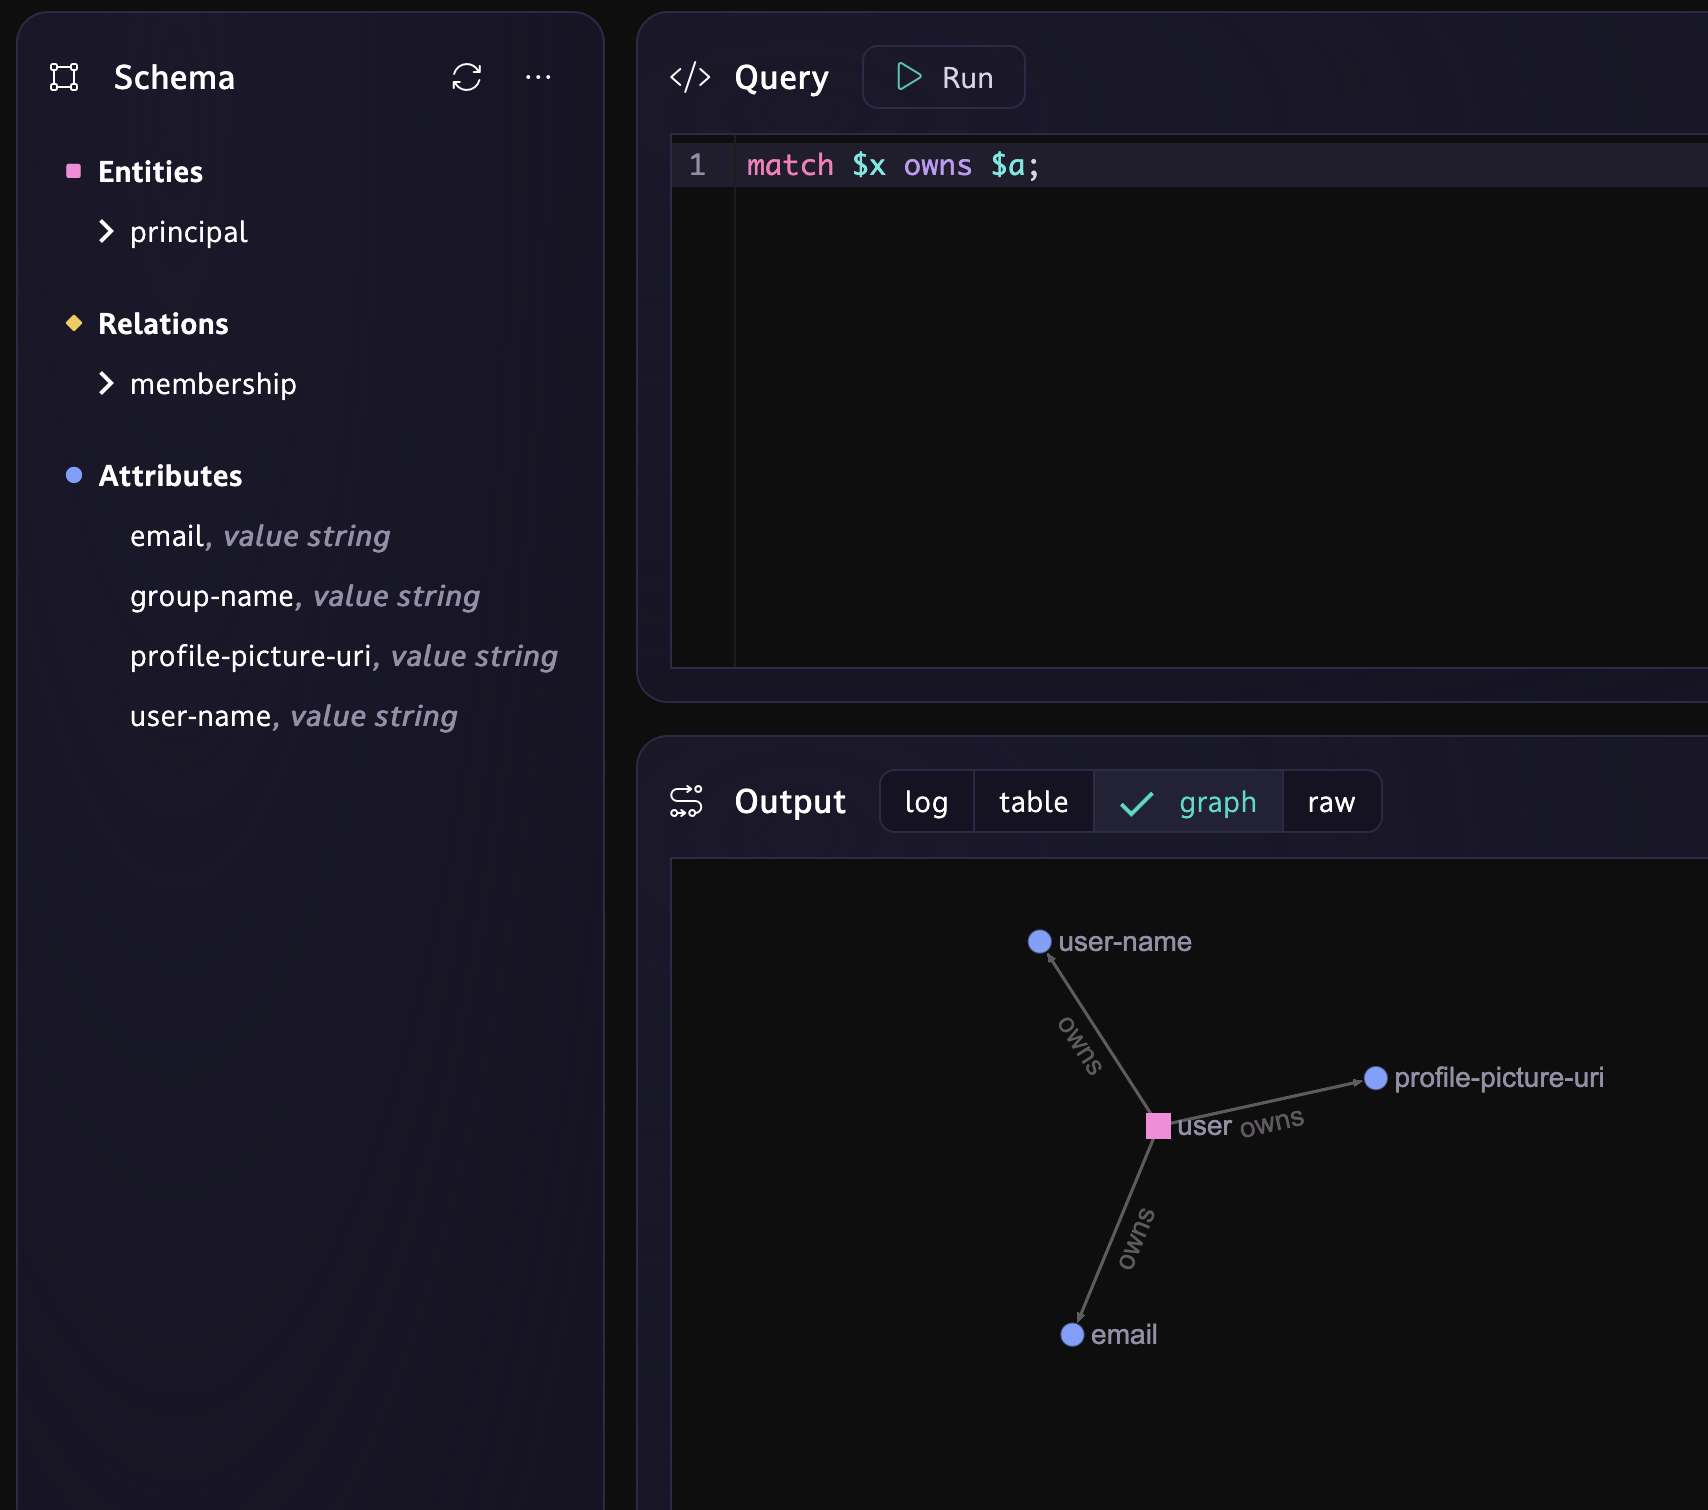
match $x has $a; should definitely be vizualising!
@alex priority item for you :))
sorry to disrupt Ai researchok, that query does generate a graph output, so it seems to work for instances of data but not the schema objects? Anyway, interesting product mgmt conversation. I agree the 'production' use case is more likely some type of api to embed in your own UI or app. But, for demos of your product, the 'wow' factor is seeing graphs. Of course people want to see the 'model' (schema) but sometimes it's too busy, cluttered etc. No biggie if that's not there, I was just wondering if there was an easy hack to customize the schema graph view.
i mean yeah i thought we could vizualise schema graphs from queries, then you should be able to do it very custom 🤔
I believe the Schema page is really powered by 2-3 queries under the hood. By now I think TypeDB might be able to do that in 1 query & so you can do the viz in the query page as well. But not 100% sure on that right now
oh wait nevermind @alex it's working!
@davidg you don't see anything like this?

i dunno why
entity $t doesn't work though
try this query @davidg
woud be nice to be able to minimize the history paneThanks that works.

just added one more thing
this is great! now you can decide what things you want to visualize by filtering in the query
optionals are not thoroughly tested yet (experimental) but i thinkshould be ok for this !!
so cool 😄
did you customize the colours somehow?
no im not quite sure how they're being chosen right now
i think it's based on the variable somehow
note that i think this also doesn't viz anything that has 0 connections to other types
i stand corrected.... its the same. Very useful. Thanks!!
hi sorry what happened here in brief?
Main this is wondering wondering why single types don't visualize - match entity $x; @alex
I think we loop over constraints and draw them. We can probably loop over the vertices before we do that.
thanks for flagging this up @davidg - I'll aim to get a patch out this week so you can visualise schema vertices with no edges in Studio 🙂 i agree the current behaviour is confusing
patch is out @davidg ! https://studio.typedb.com [Web] or https://typedb.com/docs/tools/studio [docs for Desktop] ✨