M
MastraAI2mo ago
mewtwo

Possible memory leak or expected behavior?

Hey Mastra! 
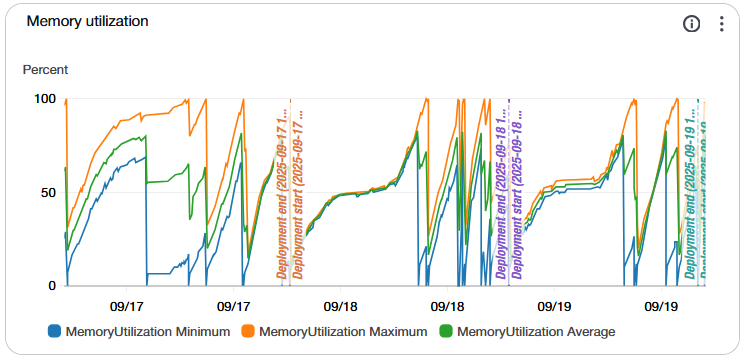
I have this strange behavior that keeps eating RAM until it hits the limit and, by using AWS ECS, it just restarts and we're good to go. I'm using ECS with 1 vcpu and 2GB RAM, which I know is not much, but due to my use case it is better to have 2~3 small instances because our workload goes down a lot after evening. We also have 1.2GB (1.9M+ rows) on mastra_messages table, 1.7GB on mastra_workflow_snapshot. But the RAM constantly increasing is an expected behavior due to the caching and memory features? If not, any suggestions on how do I even start investigating this?
No description
8 Replies
_roamin_
_roamin_2mo ago
Hey @mewtwo ! Are you using workflows?
mewtwo
mewtwoOP2mo ago
Hi @Romain! Yes, every interaction with my agents starts with a workflow to prepare data, check if should abort, make some database calls, and I also use bail() to stop execution when needed And there is also one more workflow acting as a tool for the agent to trigger when needed. createTool() which creates a run and starts the workflow inside the tool. I did this to prevent the full workflow response to be passed back to the agent context, as it is extremely long and verbose.
_roamin_
_roamin_2mo ago
Got it, thanks for the details! Do you pass large amounts of data between workflow steps?
mewtwo
mewtwoOP2mo ago
The first workflow queries the last 30 messages from memory in a .map(), before passing it to the step (.then) and the response is simples as
return {
messageToAgent: response.text,
};
return {
messageToAgent: response.text,
};
But the .map part could get up to 30 messages long, and those messages include varying amount of text. The last snapshot in our database have 24kb.
const thread = await agentMemory.getThreadById({
threadId,
});
if (thread) {
const msgs = await agentMemory?.query({
threadId,
selectBy: {
last: 30,
},
resourceId: thread.resourceId,
format: "v1",
});
memoryMessages.push(...msgs.messages);

console.log(
"[INFO] Memory messages",
JSON.stringify(memoryMessages, null, 2)
);
}

[...]

return {
prompt: "not_too_long_prompt",
messages: memoryMessages || []
}
Found one snapshot with 47kb In summary 1) The first thing in the workflow is a .map() that queries last 30 messages and passes to next step 2) The step returns only a { messageToAgent: string } object 3) Commit called, no other step
Mastra Triager
Mastra Triager2mo ago
GitHub
[DISCORD:1418706304167575652] Possible memory leak or expected beha...
This issue was created from Discord post: https://discord.com/channels/1309558646228779139/1418706304167575652 Hey Mastra! I have this strange behavior that keeps eating RAM until it hits the limit...
_roamin_
_roamin_3w ago
Hey @mewtwo ! Just wondering if you're still running into this issue when updating to the latest Mastra packages?
mewtwo
mewtwoOP3w ago
Hey @Romain! The issue is gone, just tested on a brand new folder 🫡
_roamin_
_roamin_3w ago
Awesome, thanks for trying out!!

Did you find this page helpful?