High CPU load
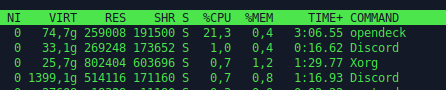
I am testing OpenDeck on Linux and I noticed that it is using about 18 % of a CPU core which seems somewhat wasteful. Is that normal?
OpenDeck v2.6.0 (bb64d0e)
Ubuntu 24.04.3 LTS (X11)
Solution:Jump to solution
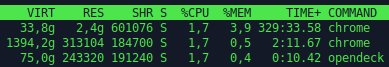
@nekename (dev)Actually, I had enough time to test even before leaving my home and it seems to work. Now the CPU load is only about 1 % even when I have 208 Chrome windows with 1125 tabs open.
82 Replies
How many plugins are you using and which ones?
The only installed plugin is "OpenDeck Starter Pack". And the load seems to be about 15 % for a CPU core even with totally empty configuration (no configuration for any of the buttons).
Can confirm. The first thought was plugins, but even after removing all of them I see about 10% of CPU load all the time
Just checked and its the same for me (around 10%) on Arch KDE Wayland with newest git.
If CPU load is typically so high even when not much should be happening, I hope it can be somehow lowered in the future.
Btw, I have usually at least several dozens of Chrome windows open. When I closed Chrome, the CPU load of OpenDeck dropped to about half of it was. I wonder is OpenDeck perhaps constantly going through of all open windows for some reason which is causing that CPU load?
very interesting, I think it is
@Skeptikko did this happen before 2.6.0?
This happens on: OpenDeck v2.6.0 (bb64d0e) on x86_64-unknown-linux-gnu
yea but i mean did it still happen before in 2.5.0 or is it new
I haven't used OpenDeck before this version
if you have any time please could you try using 2.5.1 and see if the CPU usage is still high because that would narrow down the cause
you might have to change
version in settings.json to "2.5.0" when downgradingI think it was still high (about 20 %) after I updated it recently. When I get back home, I will check if it was version 2.5.1 as I think it was. I think it was the version that fixed some configuration file integrity issue (?). I might have now even more windows open which is why the CPU load by OpenDeck is also higher.
v2.5.1 is an older version that doesn't have a specific feature that I'm thinking could be causing the problem
you're probably on v2.6.1
OK. I will try to downgrade and check with version 2.5.1.
back up your config folder first
@nekename (dev) I tried now downgrading from 2.6.1 to 2.5.1. The CPU load dropped from about 25 % to under 1 %.
it's caused by this then
https://github.com/nekename/OpenDeck/pull/122
GitHub
Implement the
applicationDidLaunch and applicationDidTerminate ...This pull request adds a new dependency (sysinfo), and implements event handling for process launch and termination, which may be required for certain plugins.
It introduces two new events, applica...
@MonkeyKiller - any ideas?
@nekename (dev) Does this also work on Linux? Else we could limit these events to Windows only.
It does work on Linux, but no plugins use it obviously
I'm just wondering why this is happening
I think
System::new_all() can be refined down to just processes instead of all values (CPU usage, RAM usage, network, disk etc)
By default, sysinfo uses multiple threads. However, this can increase the memory usage on some platforms (macOS for example). The behavior can be disabled by setting default-features = false in Cargo.toml (which disables the multithread cargo feature).So I could disable this as well, limiting it to just the one thread that tokio has made for this task
Lets try it?
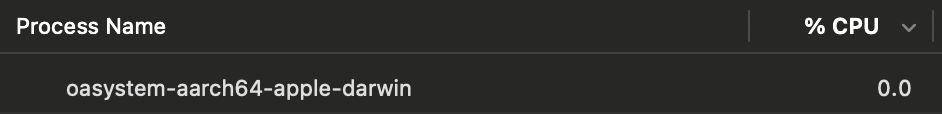
I have about 7% idle usage on macOS, I'm going to try 2.5.1
Ok, it's about 3-4% on 2.5.1
You could try to increase the time between each sysinfo refresh
I'm not sure that's the problem, it's a whole 250ms, that wouldn't cause 5% CPU usage
I think new_all might be an issue
If I remember correctly, there was another function that initialized only the required info
Lemme check real quick
yeah, that could be the issue
Maybe, it can be replaced by
new_with_specificsthere's also this
and nothing() does include tasks for some reason
seems to be the case
at least on windows it works fine, doesn't consume a lot of cpu

i haven't tried it on linux. When i coded it, i used the same refresh period used on the app monitor, just to be sure
Ok none of it is working
I tried changing new_all to new_with_specifics, using without_tasks, and disabling the default features, and it's now at 10% cpu instead of 7% lol
try increasing the time to 3 seconds for example, and check if the problem occurs in that period of time
alr
I can't tell exactly but it looks like it goes from around 10% to 6%
and that's in debug mode so less in release
maybe you could implement it so on unix based systems it uses a longer period of time between refreshes
it still doesnt really make much sense
250ms is a lot
yeah, i thought the same
but what else can we do?
i've no clue
yea
kinda odd
yeah
I need to test this on linux as well
see if changing the delay fixes it there
(im on macos)
Just tag me if I need to test something.
the actual work only takes 10ms
so sleeping for 250ms is surely enough
set_open_files_limit in sysinfo - Rust
This function is only used on Linux targets, when the
system feature is enabled. In other cases, it does nothing and returns false.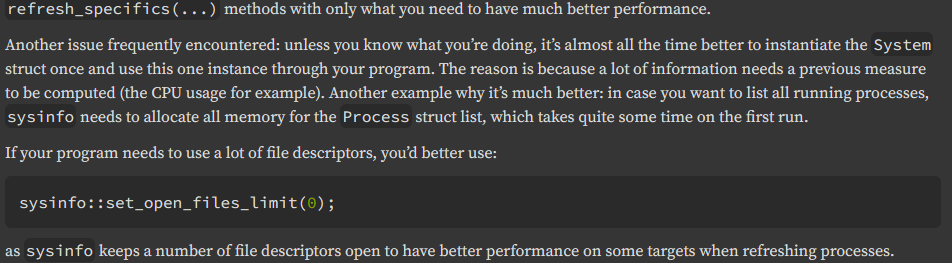
I think that means that if your program is using file descriptors for other reasons then you should disable sysinfo's use of file descriptors
because otherwise the system limit for your program will be hit
okay
i have no experience working on linux honestly
I made a plugin that uses sysinfo for CPU, RAM, uptime and OS info
and it's using 0% CPU
it refreshes every 1 sec
yeah, but your code isn't trying to refresh the process list each 250ms
maybe on linux it has a problem because of the "everything is a file on linux" thing
but no clue honestly
im on macos tho lol
i mean everything is a file is just unix i guess
isn't it unix based?
yeah
Ok, so it's around 1% less when I change new_all to new_with_specifics...
Not much of a difference
@Terrorwolf you could try the latest commit, it makes some minor changes, maybe it will help, maybe it wont do anything at all
if it doesnt do anything, lmk if changing
src-tauri/src/application_watcher.rs line 105 to use 3000ms instead of 250ms makes a differencewill do. Give me a few minutes
Its better. Its down to about 2% with your Commit with occaisional spikes to more, but these could be caused by plugins also.
what did you have before?
It was around 10%
that's good then, I'll test on Linux tomorrow
@nekename (dev) Btw, did you test it on Linux?
not yet, havent had time
I went to test the CPU usage before my fix, but I can't get it higher than 1.5%, even with more than 100 Chromium-based X11 app windows open (Chromium, Discord, Beeper, Signal, Spotify)
and that's in a debug build, not even in a release build, with plenty of plugins
also tried spawning 1000 sleep processes
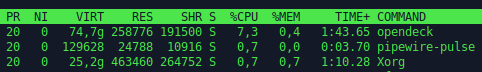
For me OpenDeck seems to consume at the moment about 7 % of CPU even when the only windows are OpenDeck and one xfce4-terminal where I run top command.
If I open just 104 Chrome windows (with 300 tabs) and Discord, OpenDeck seems to consume about 20 % of CPU even when those Chrome Windows are minimized and not visible.
I also tried to upgrade from Xubuntu 24.04.3 to 25.10, but it didn't seem to improve this problem.
I also tried this. With this change CPU load dropped from about 8 % to about 1,5 %. For some reason the CPU load was "only" 8 % when I used the source code version with "deno task tauri dev" instead of using the automatic installation script to install the released binary files where the CPU load was 20 %.
hmm, weird and annoying
Correction, actually it seems that with the pre-released binary package CPU load is at the moment about 27 %.
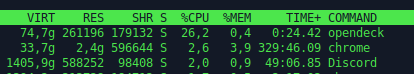
If I start additional 500 sleeping processes without Window, it doesn't seem to affect that much the CPU load of OpenDeck. However, if I close all Chrome Windows (I had 123 Chrome windows with 575 tabs open), OpenDeck CPU load drops to about 7 % with the released binaries. For the patched OpenDeck, the number of open Chrome Windows doesn't seem to change CPU load.
I also tried with lower (and higher) from_millis values. With 500 the CPU load was about 4 %, 750 it was about 3 %, 1000 it was 2.5 %, 1500 it was 2 %, 2500 it was around 1.7-2.0 %. And with 10000 the CPU load was about 0.7 %.
I am not familiar with Rust and I don't have even good idea what is happening in that task where that sleep is. I just wonder, would it be somehow possible to run that task trough some kind of profiler to better see where the time in that task is really spent? I noticed that there is for loops with three nested levels, so the time spend in that kind of loops might grow quite quickly.
I worked as a poor man's profiler and started just commenting lines out of that task to see when CPU load seems to drop. It seems that this line is which alone is consuming most of the time:
yes, for sure
Btw, is there any important reason why that line is executed so often instead of using a longer delay at least on Linux, where that call seems to be expensive?
250ms is not "so often", lmao
that's 4 Hz
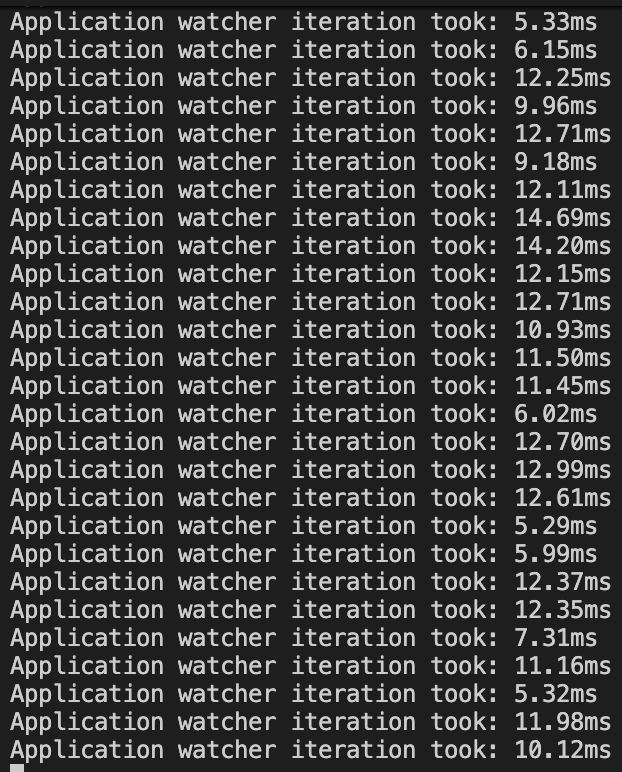
it doesn't make sense though because all the logic in the loop takes only 12 ms according to my profiling
4 Hz might be too often if that call itself takes a lot of time. For you it might be quite short time, but for many Linux users it might be much longer as the CPU load seems to get quite high. When I have time and I am in front of that computer, I could try to see how long that function call takes, when I figure out how to profile/measure time in Rust programs. Maybe I could use something from here and I hope that printing to console works:
https://stackoverflow.com/questions/26593387/how-can-i-get-the-current-time-in-milliseconds
Stack Overflow
How can I get the current time in milliseconds?
How can I get the current time in milliseconds like I can in Java?
System.currentTimeMillis()
Now I have tried to measure it with wall time. That line and everything inside that loop {} before sleep seems to take about 17 ms. And that system.refresh_processes_specifics alone seems to take most of the time. I am not sure how much if any parallel processing is going on. However, if it is run 4 times a second 17 ms * 4= 68 ms. And that is 6,8 percent out of the 1000 milliseconds of one second. This seems to be relatively close to what I am measuring when I run it with "deno task tauri dev" which shows about 7-8 % CPU load. I am not sure why the release build consumes about 25 % CPU time. But I think even that 7-8 % is somewhat high for a process that usually should not be doing much else than waiting for a button press or some similar external event.
ohhh yeah that makes sense
what do you suggest to fix it
we could disable the feature on linux since I don't think any plugins use it
also process name isn't as reliable a heuristic on linux as on windows
Could it be run at least optionally with a lower frequency/longer sleeping period? Maybe some configuration option? Or if it is needed only by some plugins, maybe it could be run less often or not at all if there is not installed any of such plugins that need it.
I'll implement the latter, not running it if no installed plugins need it, which is effectively the same as disabling the feature on Linux, since there are no Linux plugins that make use of it.
I think that it's possible that the high CPU load is only on Linux so hopefully that's a full solution
@Skeptikko I am back from China and implemented this, bringing CPU usage down from 6.5% in release mode on my MacBook to around 2%, which is nice
https://github.com/nekename/OpenDeck/commit/7eacd19703a5543ae552653941dc3a2665df2e9d
After that I also changed the interval from 250ms to 500ms, didnt measure the cpu usage change with that included, but its probably helpful because I didnt want usage to spike as soon as a Mac/Windows user installed a plugin that uses application monitoring
@Terrorwolf maybe test?
@MonkeyKiller maybe review commit?
Will do when at home
Seems good
i compiled the app with the latest changes, and it works
nice
Seems also good from my side.
we going to call this resolved?
asking @Skeptikko mainly
I will try to test that commit soon, once I am back at home. It may take some hours.
Solution
@nekename (dev)Actually, I had enough time to test even before leaving my home and it seems to work. Now the CPU load is only about 1 % even when I have 208 Chrome windows with 1125 tabs open.
awesome, looks like a fix then