Shared Pooler (Supavisor) connections graph is empty (always showing 0)

Hi, We are serving a SvelteKit app on Netlify Functions that's (just recently) using Prisma ORM, and connecting to Supabase via the
Transaction Pooler Connection string – postgresql://postgres.[your-project-ref]:password@aws-0-[region].pooler.supabase.com:6543/postgres
As described here: https://www.prisma.io/docs/orm/overview/databases/supabase 
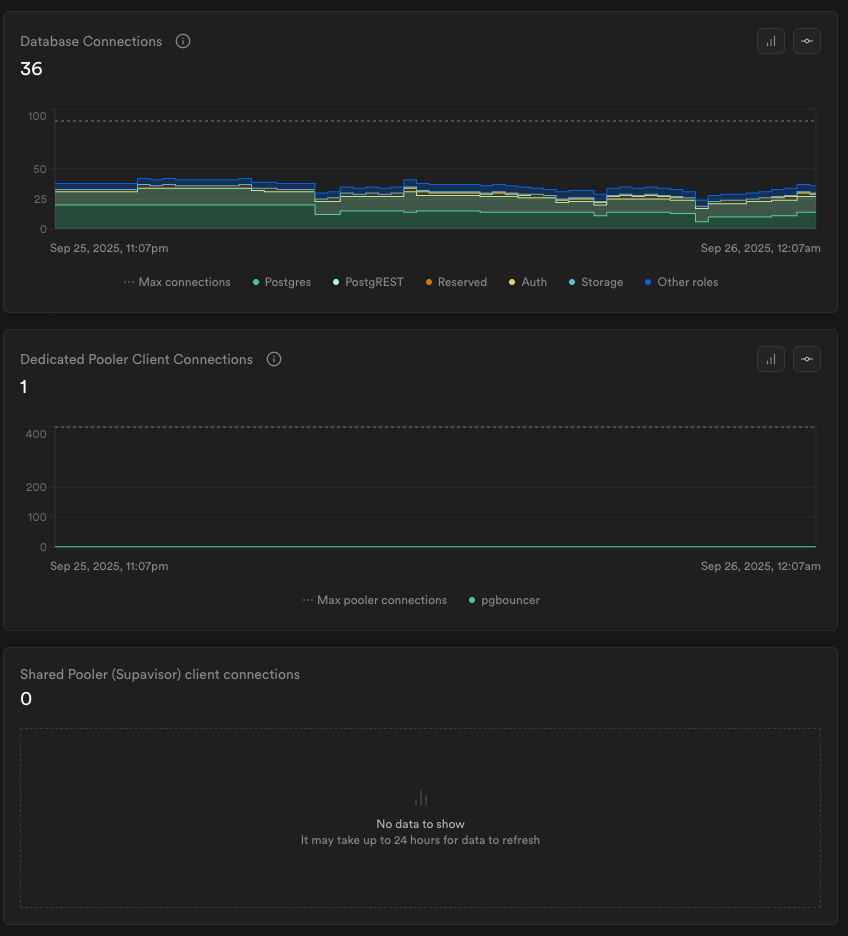
Our app is live in prod and running, but the Database Reports page graphs look like this (view attached screenshot) We've had a couple of
Timed out fetching a new connection from the connection pool. More info: http://pris.ly/d/connection-pool (Current connection pool timeout: 10, connection limit: 5)
errors happen in prod and are currently trying to debug, and those empty graphs are puzzling. Why would the Shared Pooler (Supavisor) chart show nothing?
No description
4 Replies
ihm40
ihm404w ago
I'm wondering if maybe you are using the correct uri for the shared pooler? I would have imagine that you are using the dedicated pooler hence why you have one client connection for that as apposed to the shared pooler which uses
DIRECT_URL="postgresql://postgres.[project-ref]:[YOUR-PASSWORD]@aws-0-eu-central-1.pooler.supabase.com:5432/postgres"
Note that supabase mentions Dedicated Pooler is not IPv4 compatible which may be causing issues for you related to timeouts
Isitfato
IsitfatoOP4w ago
We were using the Dedicated pooler connection string, and then switched (because of confusing/outdated docs) to the Session pooler (Shared Pooler) connection string, with port 6543 instead of 5432 We are now reverting back to the Dedicated pooler, though we had some downtime and it just sucks to have no graph to look at to see when we actually bust the limit There are logs in the Shared Pooler log section
inder
inder4w ago
For standard queries use transaction pooler: connection string with port 6543 For running migrations, either use session pooler connection string or the direct connection string.
No description
ihm40
ihm404w ago
perhaps this might be something to leave in feedback in the top right of the dashboard

Did you find this page helpful?