Error: "more than one row returned by a subquery used as an expression" when accessing a table

Description: When I try to open the user_query_counts table in the Dashboard, I get the following error:
Failed to retrieve rows from table
Error: more than one row returned by a subquery used as an expression
Failed to retrieve rows from table
Error: more than one row returned by a subquery used as an expression
Steps to reproduce: 1. Open the Dashboard. 2. Navigate to the user_query_counts table. 3. The error occurs immediately. Expected behavior: The table should load and display normally in the Dashboard without errors. Actual behavior: The Dashboard fails to display the table and shows the above error. Error message / Logs:
{
"event_message": "more than one row returned by a subquery used as an expression",
"sql_state_code": "21000",
"application_name": "postgrest",
"command_tag": "SELECT",
"database_name": "postgres",
"user_name": "authenticator",
"query": "WITH pgrst_source AS ( SELECT \"public\".\"user_query_counts\".* FROM \"public\".\"user_query_counts\" WHERE \"public\".\"user_query_counts\".\"user_id\" = $1 LIMIT $2 OFFSET $3 ) SELECT null::bigint AS total_result_set, pg_catalog.count(_postgrest_t) AS page_total, coalesce(json_agg(_postgrest_t)->0, 'null') AS body, nullif(current_setting('response.headers', true), '') AS response_headers, nullif(current_setting('response.status', true), '') AS response_status, '' AS response_inserted FROM ( SELECT * FROM pgrst_source ) _postgrest_t",
"timestamp": "2025-10-02 22:33:44.902 UTC"
}
Environment: * Supabase Dashboard * Role: postgres * Platform: Web (browser) Question: Is this caused by a misconfigured view/trigger in user_query_counts, or is it a bug in the Dashboard/PostgREST wrapper? How can I get the table to render properly again?
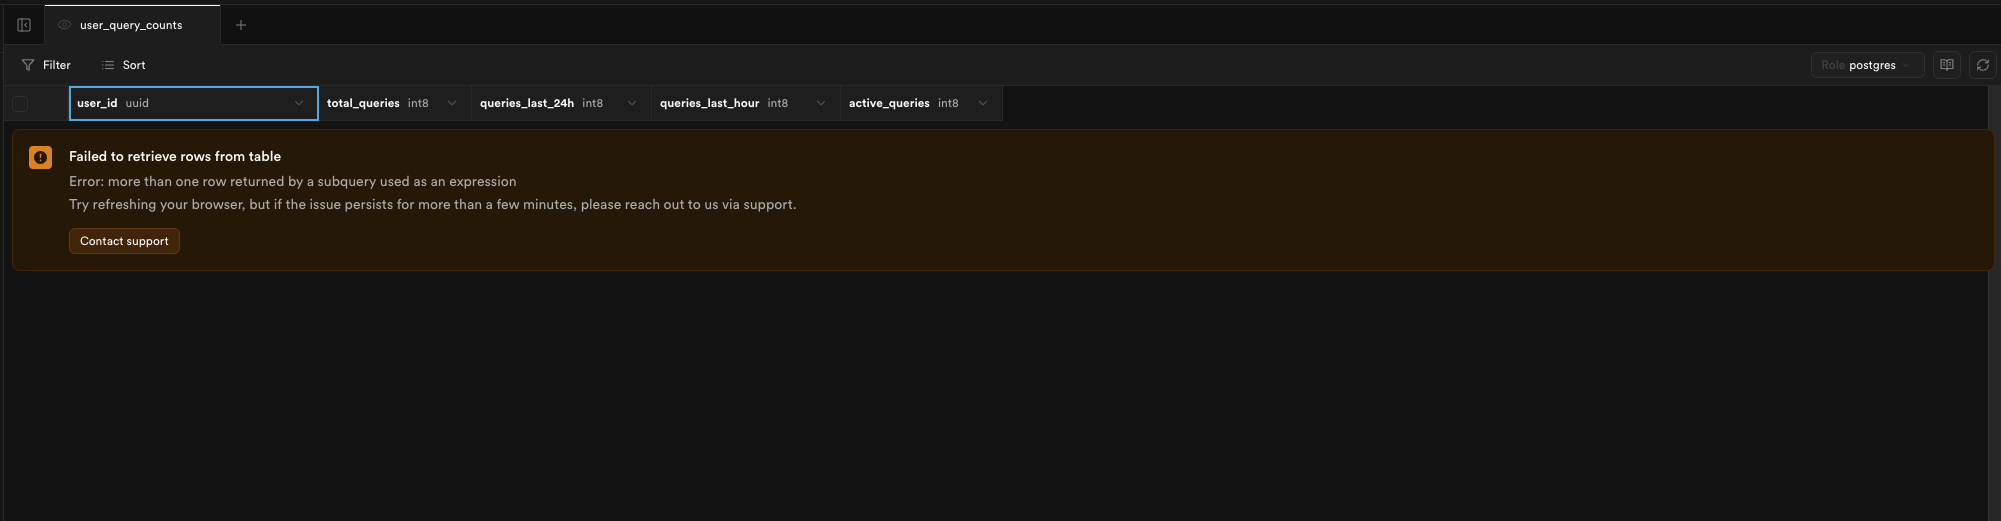
No description
5 Replies
silentworks
silentworks4h ago
Try in a different browser. Did this table have data in it? how was the table created?
Steve
SteveOP4h ago
I will try. It had data in it. Not sure how it was created but I can check. I’ve also tried using Safari instead of Chrome, but I’m still encountering the same error. Since the issue is impacting our application’s functionality, it doesn’t seem to be browser-related.
silentworks
silentworks4h ago
Try restarting the database and see if that yields any better results
Steve
SteveOP4h ago
It's restarting I also noticed that user_query_counts is a view and not table
silentworks
silentworks4h ago
Maybe something changed with the underlying table/tables that this view is created from.

Did you find this page helpful?