Serverless Worker Crashed but Request Still Running
A serverless worker suddenly died. However, an inexplicable phenomenon occurred — the request is still being processed.
Endpoint ID: h10qsr3s6f5puk
Request ID: 1c30dc85-d5e4-472d-b5e8-034d40249e7c-e2
Worker ID: 01yuqqrddjl88x
1. The worker suddenly stopped processing.
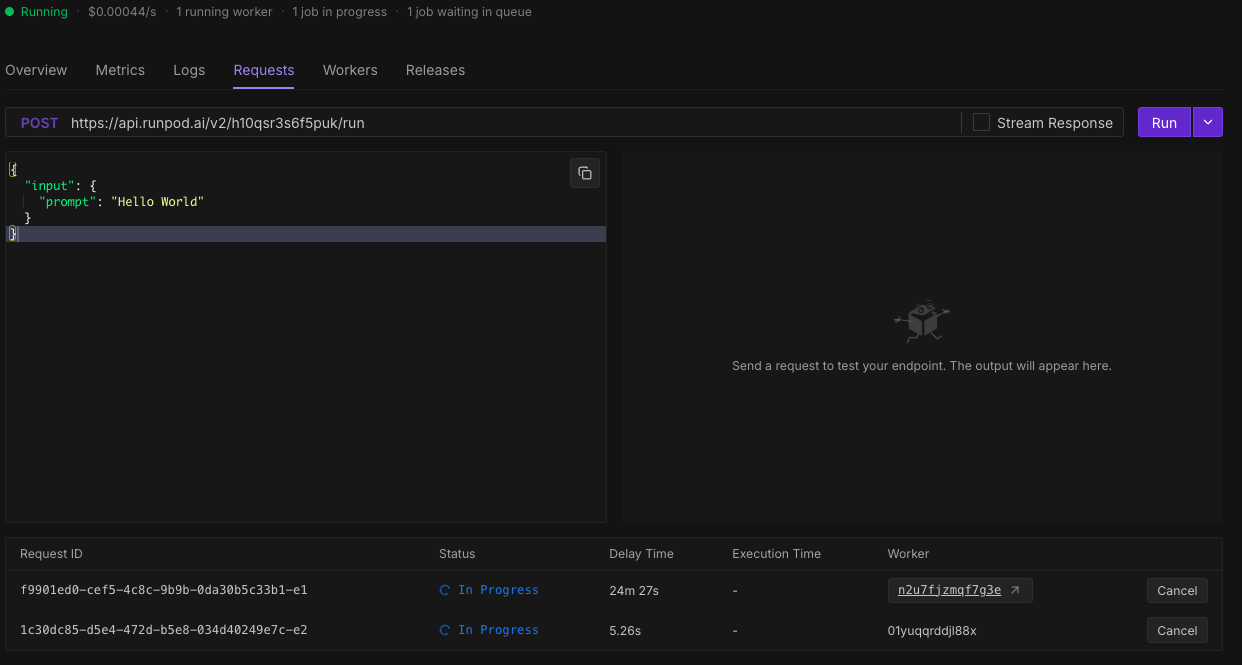
2. A strange phenomenon was observed on the Runpod management dashboard.
3. At the bottom of the screen, two “In Progress” indicators are shown, but at the top, it displays “1 Worker, 1 Progress, 1 Queue,” which is inconsistent.
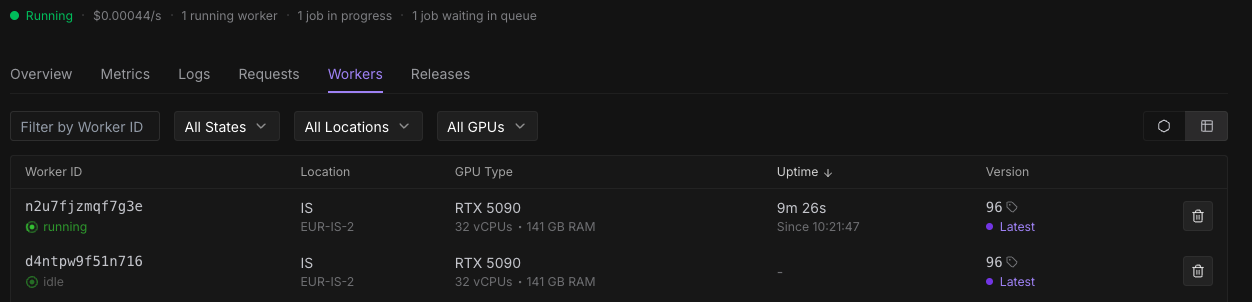
4. The worker “01yuqqrddjl88x” at the bottom of the screen is grayed out and no longer appears in the worker list.
5. However, it is still continuing to process tasks at this very moment.
This issue is still ongoing. Please investigate immediately.


20 Replies
What on earth—?! I just checked, and the Worker ID has changed!!!!
This is clearly a critical issue!

I can’t make sense of this anymore.
According to our database, this Request ID was issued at UTC , which matches the delay time shown in the last attached image.
However, when checking the logs of the corresponding worker, it appears that the worker started processing exactly at the time corresponding to the execution time subtracted from that timestamp.
In other words, what I’m saying is that the original worker 01yuqqrddjl88x had been processing correctly for nearly an hour, but after it suddenly died, its entire process seems to have been “absorbed” into the delay time, and the task was silently replaced by a newly assigned worker jfehz7prtpm3bk.
If the worker died and failed, shouldn’t it actually fail instead of pretending it never happened?
I would like to receive a clear answer from the staff regarding this matter.
1. Is this phenomenon expected behavior, or is it an anomaly?
2. If a worker dies midway, is the time spent up to that point billed or refunded? (As far as I understand, serverless systems are typically billed in real time while in use.)
3. If a worker dies midway, it becomes difficult for us to accurately measure the actual processing time used for the request, which prevents us from issuing correct invoices to our customers and creates a critical business flaw. (This is because the execution time of a terminated worker gets absorbed into the delay time, making it appear as though it never executed.)
4. When a GPU server suddenly dies, is it not possible to immediately treat the request itself as failed without attempting recovery?
@Dj There are too many "retried" operations.
It is becoming difficult to provide stable service to our customers.
The sudden failure of GPU servers is significantly degrading our service quality.

I found it.
It is evident that the quality has clearly declined since the 14th.


If a worker dies midway, is the time spent up to that point billed or refunded?It emits an error status that we use to stop billing.
In other words, if a worker dies midway and the task is retried, the webhook sent to my API server shows the status as COMPLETE. However, does Runpod internally issue a different status from the COMPLETE status notified via the webhook, to ensure that no billing occurs in such cases?
Unknown User•5d ago
Message Not Public
Sign In & Join Server To View
What happens in the following use case?
1. A worker runs a process for 1 hour.
2. The worker encounters an issue and crashes.
3. For some reason, it is “retried” and runs for another 5 minutes.
4. The request status becomes COMPLETE.
5. The webhook shows a delay time of 1 hour and an execution time of 5 minutes.
6. However, at step 1, my balance should have already decreased.
In this case, will I be charged for 1 hour and 5 minutes, or only for 5 minutes? Which one is correct?
The issue I am describing in the thread consistently refers to the phenomenon where a retry occurs due to “Retried,” and the process in step 1 is absorbed into the delay time.
Unknown User•5d ago
Message Not Public
Sign In & Join Server To View
In the use case I presented, is the charge for 1 hour and 5 minutes, or just for 5 minutes?
Unknown User•5d ago
Message Not Public
Sign In & Join Server To View
it clearly doesn't look right, lol)
Unknown User•4d ago
Message Not Public
Sign In & Join Server To View
That’s a strange story.
The issue where the worker in the use case I presented suddenly dies is, in my assessment, not our problem. It is Runpod’s problem.
However, you are claiming that problems on Runpod’s side are not subject to billing.
It’s true that it runs for the first hour, but the malfunction occurs during that process, and the fault lies with Runpod. (The log I attached clearly shows that the WorkerID was swapped, which is definitive evidence.)
However, even though the problem originates from Runpod, you still intend to charge for the one hour that was consumed as delay time.
It appears that I need to have Runpod refund the fees that have been improperly charged so far.
Please escalate this matter to a support ticket.
@Dj Please escalate this matter to a support ticket.
@KaSuTeRaMAX
Escalated To Zendesk
The thread has been escalated to Zendesk!
Ticket ID: #25332
Unknown User•4d ago
Message Not Public
Sign In & Join Server To View
We cannot collect the cause of a worker’s sudden death.
Because the same request is retried on a different worker, the webhook we receive is sent by the worker that handled the retry (i.e., a normal worker).
Even if we try to reproduce the issue, we do not know which worker will suddenly die.
As you said, if a worker dies for any reason, a different worker performs the retry.
To add, as shown in the screenshot I attached, the worker ID 01yuqqrddjl88x is grayed out, and I am unable to obtain its logs.
Furthermore, this retry issue was observed particularly frequently between October 14 and October 15.
I have not made any image updates or data center changes for nearly a week.
This period coincides with the time when RTX 5090 availability was low, and it may also be related to the maintenance that has been talked about in General.

Unknown User•4d ago
Message Not Public
Sign In & Join Server To View
I will share updates on the ticket’s progress in this thread as needed.
At the moment, the issue is under investigation, and it seems that potential workarounds are also being considered.
Additionally, on my endpoint, the issue occurred only between the 14th and 15th, and there have been no occurrences since then. It is therefore highly likely that the issue was caused by the maintenance.