Constant OOM kills
Hi there!
The past few weeks we've encountered some problems with our LAPI running out of resources and eventually getting killed by OOM-killer.
It has already happened twice today, and we can't seem to correlate it with a larger amount of alerts coming in.
Our LAPI runs in a VM with 12 gigs of RAM, and it ends up consuming all that (normally the whole VM sits at around 1-2G of RAM usage even during peak load).
Our graphs show that average load and the number of interrupts & context switches also goes through the roof when this happens. The VM doesn't run anything else other than a SaltStack agent.
Our LAPI is version 1.7.1, and I cannot seem to find anything in the logs as to what is happening. The logs are basically cut when it runs out of resources, and they start again when the process restarts after being oom-killed.
Based on your previous advice, we updated LAPI first, but we still have a few machines running 1.7.0. Could that be the cause of the issue?
20 Replies
Important Information
This post has been marked as resolved. If this is a mistake please press the red button below or type
/unresolve© Created By WhyAydan for CrowdSec ❤️
We have updated all the crowdsec machines and bouncers to the newest version. It is still getting OOM killed every 10-30 minutes, with CrowdSec at one point requiring 15G of RAM according to the OOM-killer logs.
This is a bit concerning.
For reference, under normal circumstances it runs fine, with memory footprints like this:
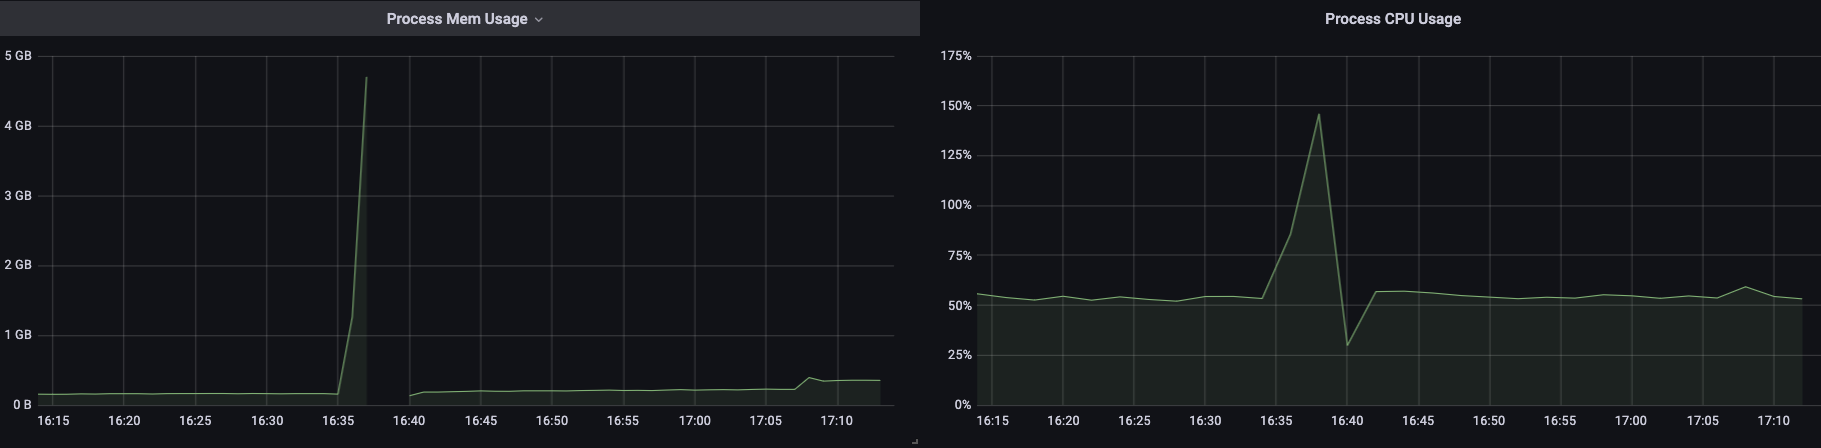
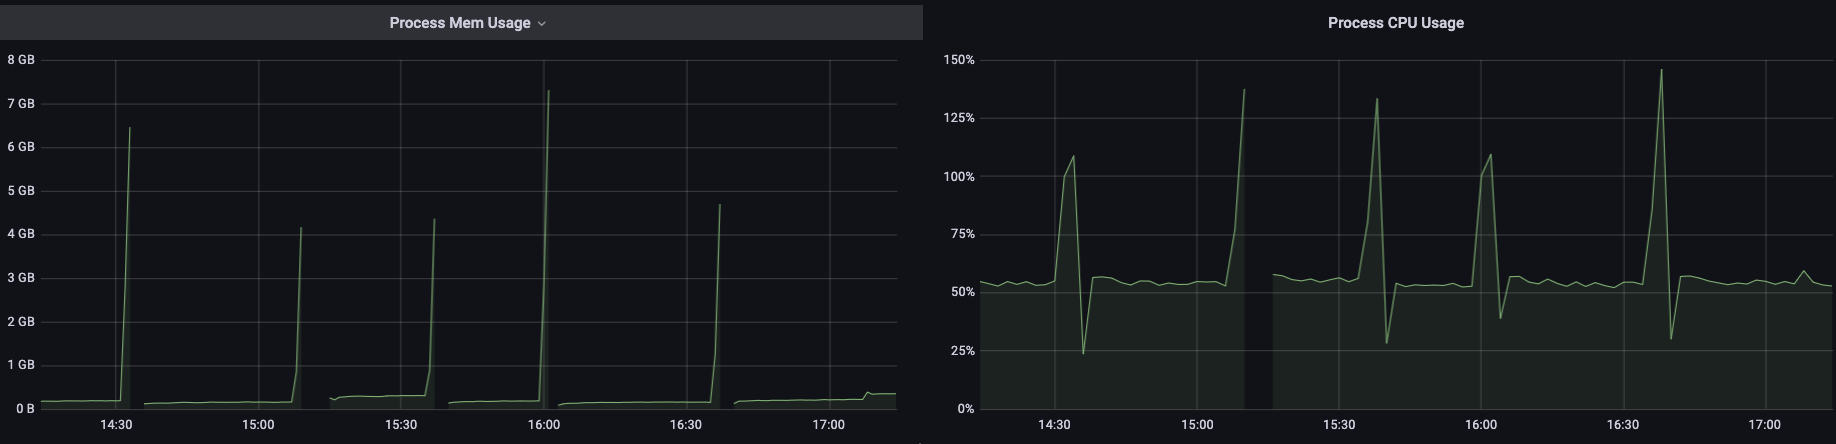
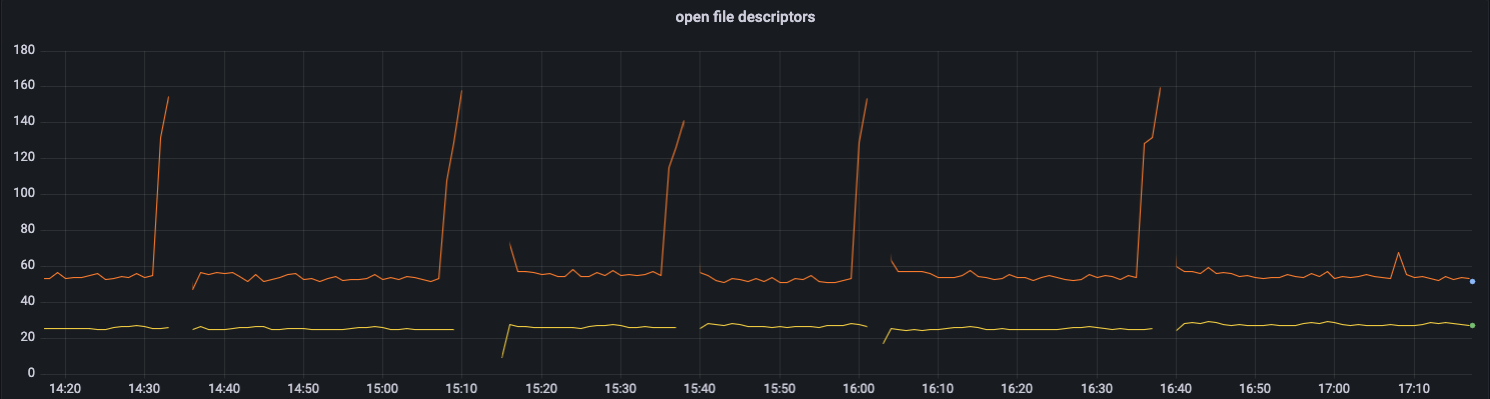
Whenever there is a gap, that is where it got oom killed.
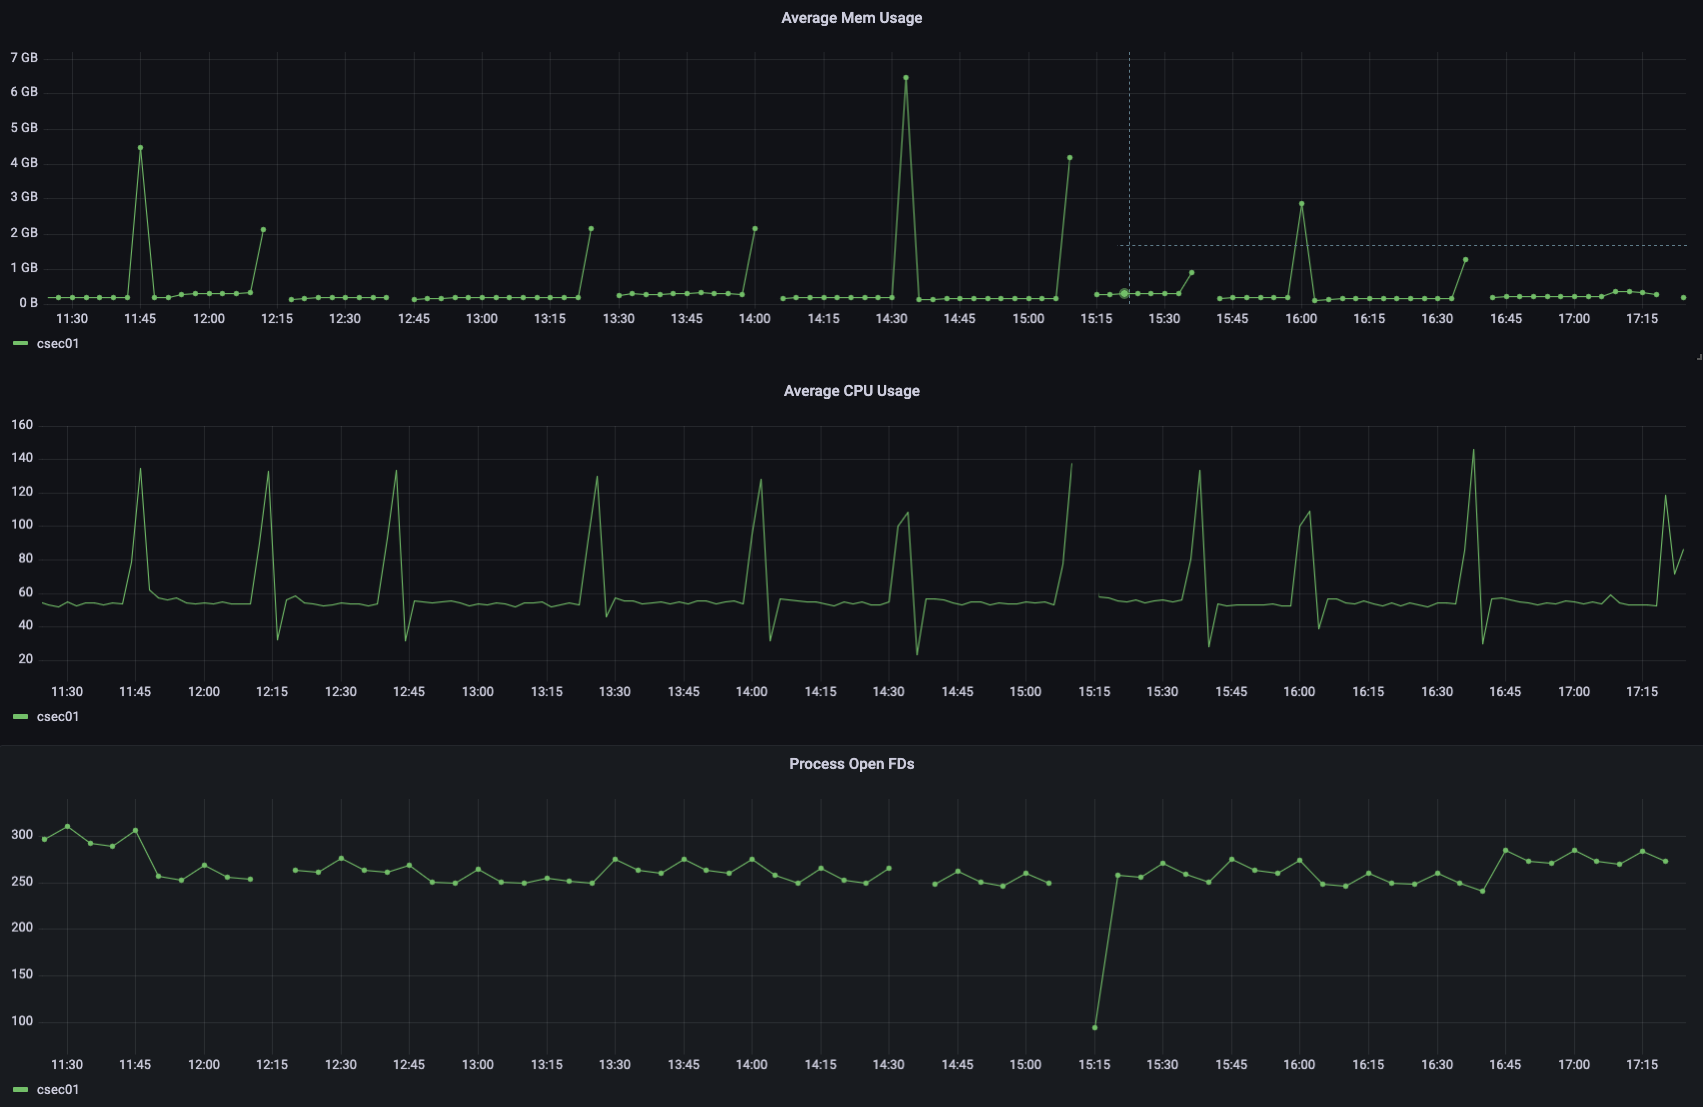
its odd that it every 30 minutes and the only thing in crowdsec that happens every 30 minutes is the new metric system. How many log processors talk to this LAPI?
Around 100
Maybe you have intermittent excess of logs to process (bot scans) that trigger more log lines and it just floods the lapi? Could you correlate it with the log volume processed, or number of requests etc?
We couldn't correlate it, not really. And also it basically 12x's the memory usage, that seems way too excessive even for bot scans.
We'd need the LAPI logs to see if we can find anything interesting + a pprof heap dump when the memory usage starts getting too big.
And just to reiterate something that we, I think, mentioned before: 100 LPs is way outside the support we are willing to provide for community users.
If you provide us with the data, I may have a quick look because I'm a bit curious as to how it could happen and hope it's something simple, but we won't be able to dig deeper if the issue is more complex
Alright, thank you!
I'll send the heap dump(s) and the logs in private.
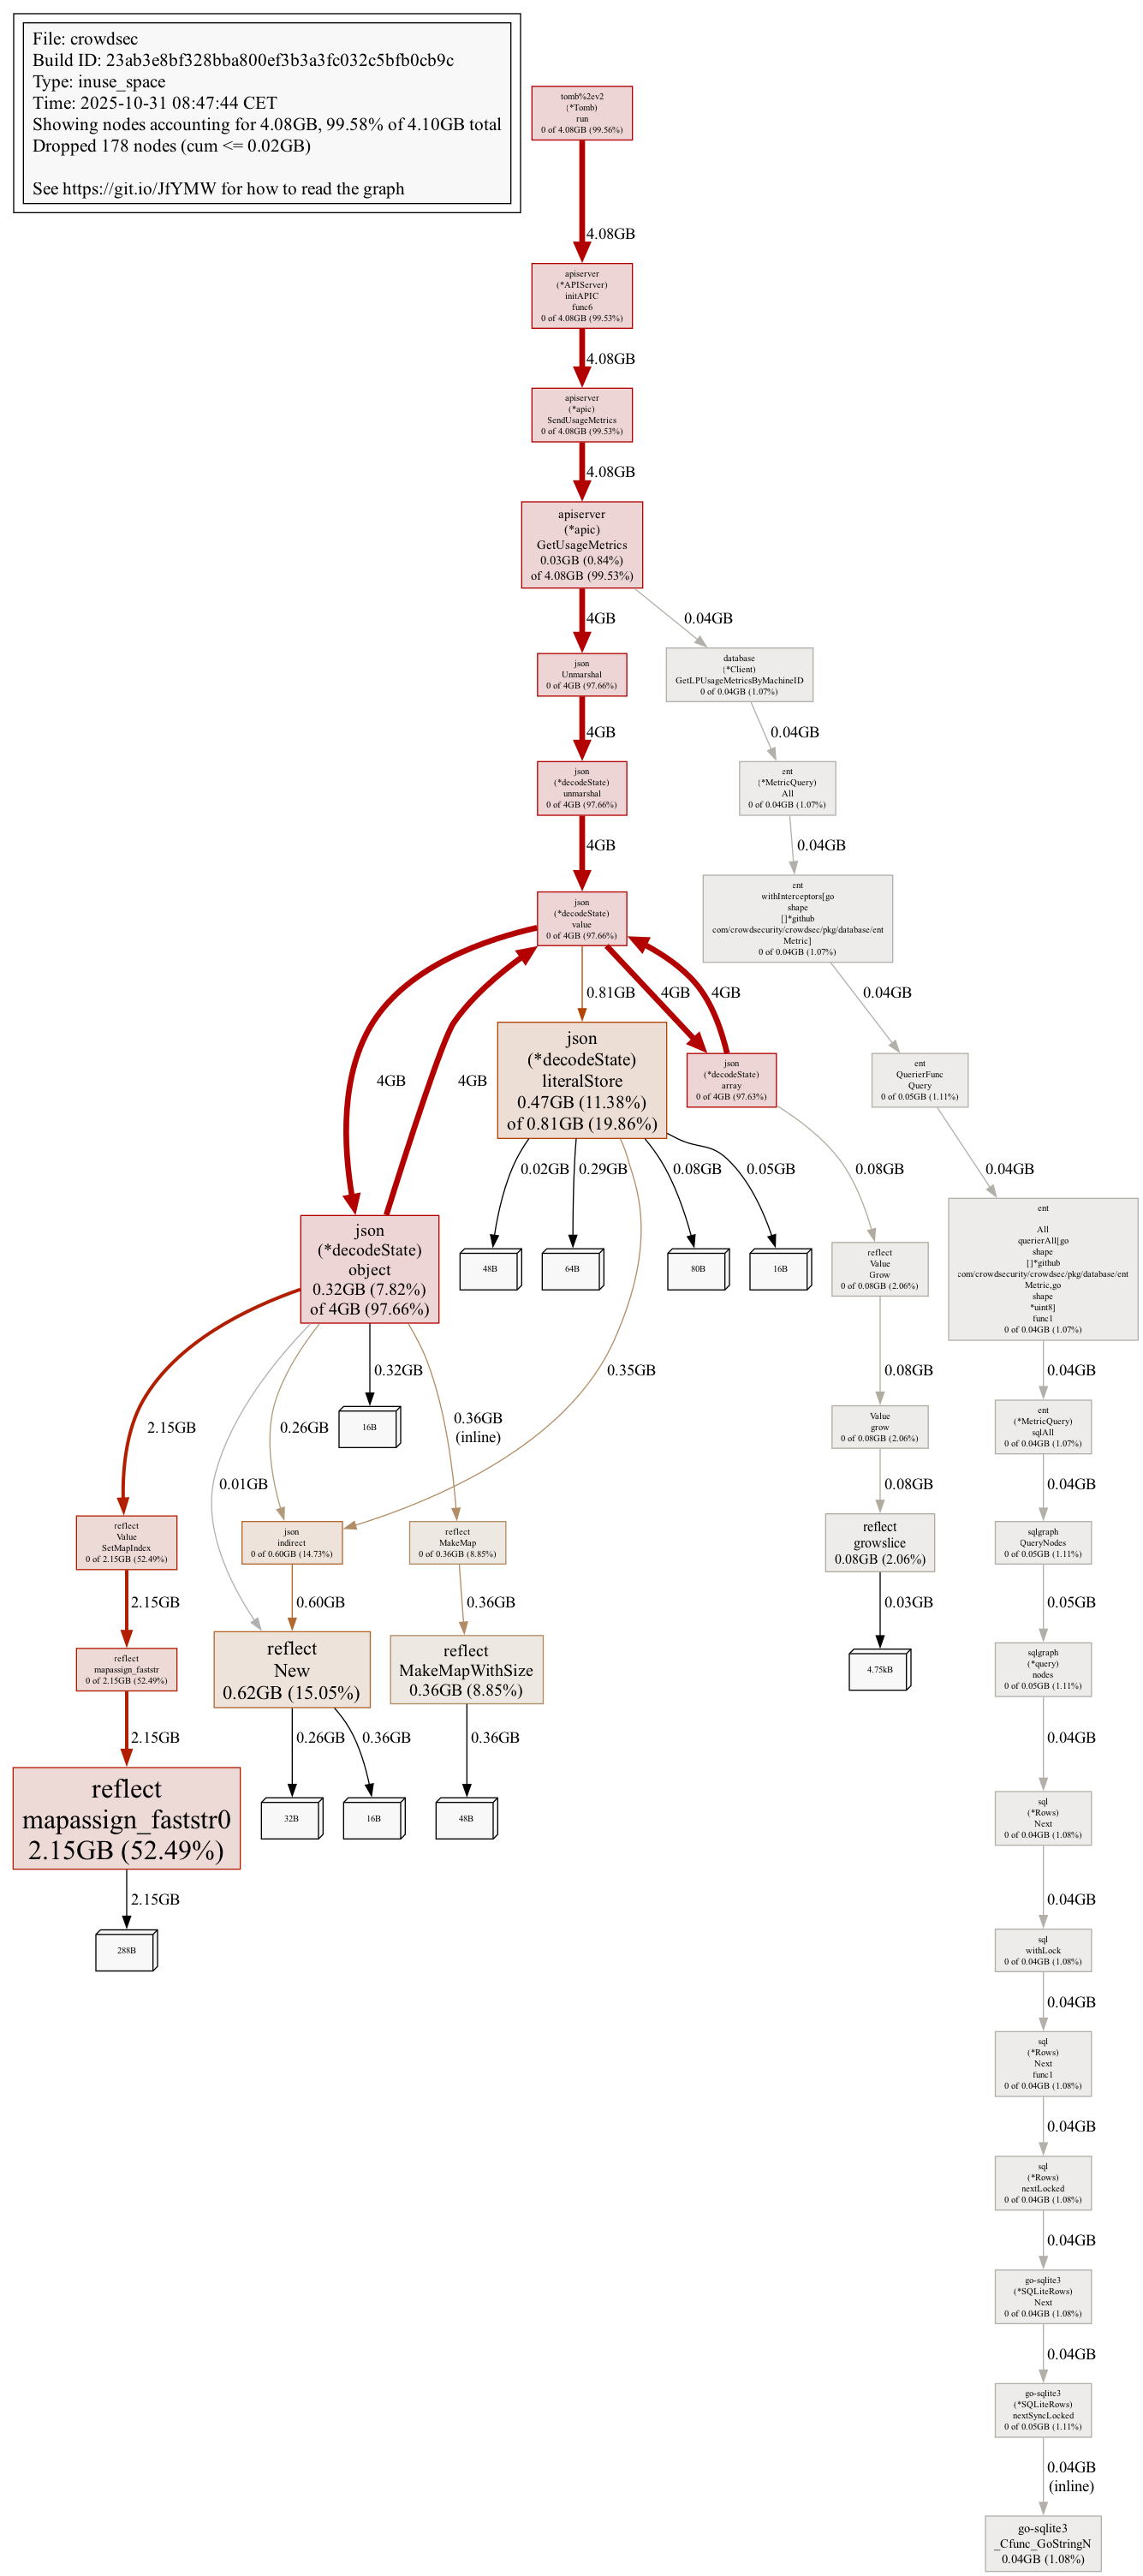
I'll include the heap dump here as well as it doesn't contain any sensitive data.
According to these, it really does have to do with the new metrics system.
Can you manually query the DB and give me the results of:
-
SELECT COUNT(*) FROM metrics;
- SELECT COUNT(*) FROM metrics WHERE pushed_at IS NULL;
If you could also send me in a private a few examples of metrics stored in the DB: i'm guessing each log processors is reading a lot of different files ? (if you are using sqlite, please type .mode lines before running the query, it will help make the output more readable)
I think you can workaround the issue by setting db_config.flush.metrics_max_age to something like 10m (do that after having ran the queries above).
This will force crowdsec to delete the metrics that are more than 10 minutes old (the 1st time crowdsec will delete them might take quite a bit, as it looks like the table is huge).
As they are sent every 30 minutes, this will effectively prevent crowdsec from sending them to CAPI (we drop them server side for people not using the console, so no change on that part, but you will lose the detailed bouncer metrics in cscli metrics + the detailed acquisition metrics in cscli machines inspect).
The underlying issue likely that a 1st push failed, and crowdsec will keep retrying sending metrics that are not tagged as pushed, so it only gets worse over time.Yeah, this seems spot on:
I'll send you the examples in private.
I'll try the flushing config.
if the flush takes too long, you can also stop crowdsec, and manually truncate the
metrics tableAlright, I've set the config and it truncated it pretty fast.
I'll report back in an hour if we had any OOM kills.
Thank you so much for the help!
This seems to have fixed the issue. Thank you very much!
Resolving Constant OOM kills
This has now been resolved. If you think this is a mistake please run
/unresolve