Performance Footguns? Slow on prop changes.
I'm noticing FPS dropping as I migrate from useQuery to useLiveQuery.
I'm going from tanstack-query
useQuery() with deeply nested graphql queries + prop drilling, tanstack-db + electric sql keeping all data synced and local, using useLiveQuery() to join and select exactly the data needed.
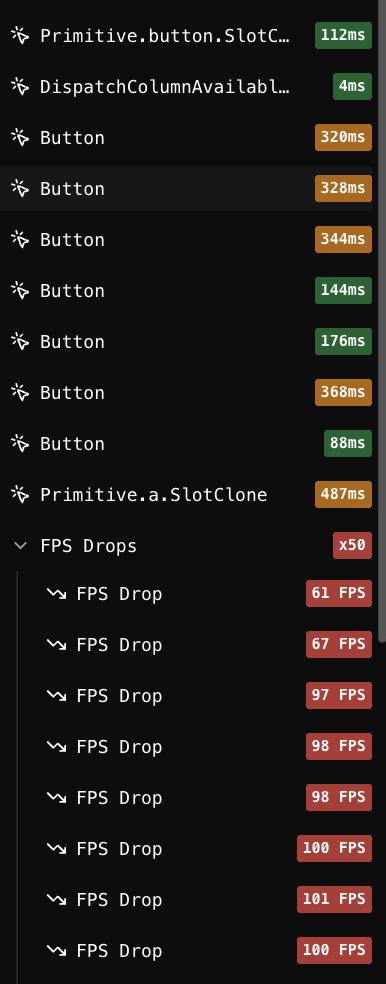
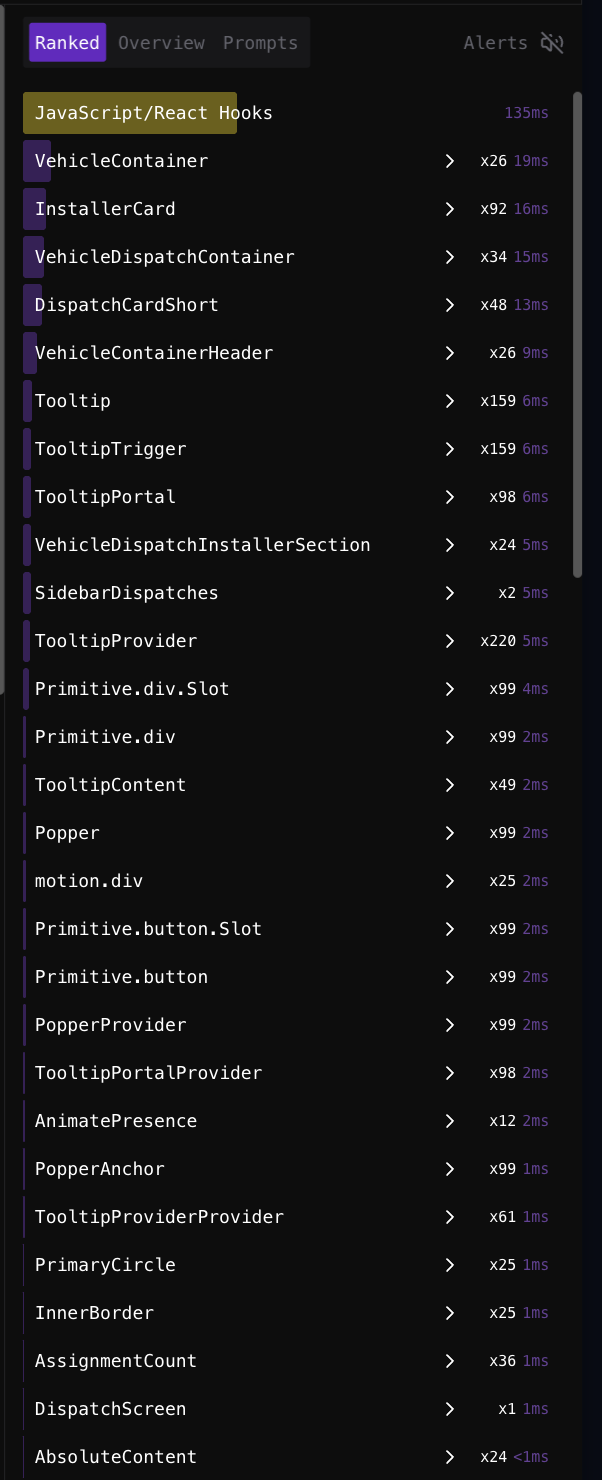
It seems part of the reason stems from the fact that the data is all there, so when every component on our Dispatch screen is on-screen and then the date prop changes, every single one of them has a change in the where clause at the same instant. A few of the collections have tens of thousands of records, and are joined with 5 others for a given component.
I really like how the jotai library has a performance page where it shows the Do's and Don't's for usage when it comes to performance footguns, so I thought we could start a thread for surfacing what those are, and can eventually add what we learn to docs?

76 Replies
typical-coral•2mo ago
cc @samwillis — curious to hear more details about the queries & data? Could you share them? There's still plenty of perf optimizations to be found and you might have just hit a current slow path. 5 joins isn't necessarily an issue
jolly-crimson•2mo ago
hey @evan
so when every component on our Dispatch screen is on-screen and then the date prop changes, every single one of them has a change in the where clause at the same instantare you doing a query on each record of a result set? How many live queries get recreated at the same moment?
conscious-sapphireOP•2mo ago
So for example, our dispatch screen.
- Dispatch: Left sidebar shows dispatches, which are Work Orders scheduled for today than can be assigned to Vehicle
- Vehicle Dispatch: Dispatches already assigned to a Vehicle
- Installer: Right sidebar, list of installers available
- Installer Dispatch: Installer cards that have been assigned to a job + vehicle
- Vehicle Date: Vehicles available to assign work to for the selected day
(photoshop-blurred names for privacy)


conscious-sapphireOP•2mo ago
Each one of the "cards" you see triggers at least one
useLiveQuery, and often relies on another since we don't yet have a good mechanism for 1:main joins.
Since a WorkOrder and its related Contract, Customer, Jobsite, etc gets used throughout the whole app, I have a reusable Live Query Collection that joins them:
So here's an example of the 1:many joins workarounds.
For each Vehicle Dispatch (one of the jobs assigned to a truck in the center section), we need an ordered list of Installer Dispatches (assigned installers), so I get a list of ids from this hook:
Then each installer card has that blue circle with the number - that's the indicator of how many jobs they're assigned to for the day, which comes from:
and of course for the installer info, just use the reusable hook:
All of the colorful Dispatch cards get their display info from this hook:
jolly-crimson•2mo ago
Ah, ok. So yes, creating a lot of new live queries in the same frame will take a little time. We can likely better cache parts of the query, or find a way to reuse them when the params change. But really the solution is going to be the "include" feature we plan: https://github.com/TanStack/db/issues/288
I'm keen to work on this as I think it will solve the issues you are facing. You would not have all the live queries inside all the sub components, just one at the top that defines the structure of the data you want.
There is likely a route to us implementing a first version of includes, but without orderby+limit inside the include. There is a refactor of our internal topK opperator in order to support them
Do you think you can possible model the data with a single live query with the proposed includes?
conscious-sapphireOP•2mo ago
Before the migration when I started syncing flat collection per DB table, I had a graphql resolver that used the Django ORM to join everything very efficiently. Let me see if I can grab that.
Here's the one that gets all available vehicles and the Jobs & Installers assigned for a given day:
And the one that gets all the dispatches for the day, whether they're assigned or not:
And the "shape" I'd pull from the first of those two:
Though shifting mindset to what that would look like in a
useLiveQuery, I think it'd still end up being three separate ones for the whole screen:
1. All Dispaches for the day (left sidebar)
2. All Installers available for the day (right sidebar)
3. Current state of vehicles and assignments (main center section)
The first of which I can actually do now:
And right sidebar:
So I guess it's just the middle one that'll get hairy. I'll work on the theoretical live query that uses the forthcoming includes. Will take a bit.
So I guess the center section would use this
Though doesn't this defeat some of the benefit of the select() giving us just the bit of data we need for a given component, resulting in the same prop-drilling and re-rendering that I have now with my large graphql queries? @samwillis
The big selling point for me was that it takes care of both joins and subscribing to data locally, preventing unnecessary re-renders.
The way I was doing it with graphql was to put the useQuery result into jotai atoms in a normalized fashion, so I'd have my nested arrays of ids but then a bunch of atoms like vehicleDispatchByIdAtom that allows me to get the properties of any given record by its id with a memoized selector.jolly-crimson•2mo ago
That should work well.
The intention with the includes is that each includes subquery becomes a ChildCollection prop on the parent row. When a child changes it won't trigger a change and rerender the parent. You pass the childCollection to a useLiveQuery itself to extract the data and gain the reactivity.
So for the vehicleDates subquery you would do
useLiveQuery(vehicle.vehicleDates)
You will have minimal rerenders but with a single persisted query at the root.
We will also have an asArray operator that materialises the subquery to an array rather than a collection, triggering a change to the parent. This is useful if you have say a list of tags you want to render and don't want the overhead of having a child component to render them.
Internally the includes become a single branch in the query engine, it's not running the subquery for each time, it runs it once for all rows and fanning the results out to them.conscious-sapphireOP•2mo ago
The
asArray operator is likely exactly what I need for this use case:
conscious-sapphireOP•2mo ago
Yikes, doing the big query at the top didn't serve the sidebar well. That's about a 10x slowdown. hmm.

jolly-crimson•2mo ago
Did you try with the subqueries? That's not implemented yet... I'm surprised it did anything.
Implementing includes is next on the list of features I want to work on after we ship the incremental sync.
conscious-sapphireOP•5w ago
No, the sidebar query is here: https://discord.com/channels/719702312431386674/1431291621932273674/1431315793668345917
I had moved the subqueries outside of the hook as just a file scoped new Query(). Moving it back into the live queried sped it back u pto 400ms.
Alright, it seems that many useLiveQuery's is more performant than any JS transformations I can do on 2-4 big ones.
~200ms to get all this joined data from fairly large collections (13 collections, 8 of which are 1000-10,000 items each) isn't awful, especially in comparison the network latency of a graphql request (despite the postgres query being much quicker when it does all the joins and aggregations on the db side).
The problem is that it's blocking. I wish I could do what I did with react query, where I'd use
placeholderData for the 200-1000ms network response, just dimming the placeholderData in the UI. It was smooth and fluid, and animations were 60fps+ when the new data came in.
db as it is is still technically faster, but when I change that date prop, the UI just hangs till all the useLiveQuery calls have resolved.
Is there a way to make the useLiveQuery calls to not block the rendering to keep FPS?typical-coral•5w ago
have you tried btw creating more persistant live queries with that elevate your where clauses to have far smaller collections you're joining?
conscious-sapphireOP•5w ago
Yes, that's what got us down from 2000ms to 400ms.
typical-coral•5w ago
how big are the collections you're joining now?
conscious-sapphireOP•5w ago
Not crazy.
jolly-crimson•5w ago
Is this slow down on every query, or just the first after a refresh?
And is it one specific query, or calling a useLiveQuery per row?
I'm keen to dig into this, I don't suppose you could make a small reproduction with some anonymised data?
I'd love to dig in and understand exactly what's happening.
typical-coral•5w ago
yeah, this doesn't seem like it should be that slow
conscious-sapphireOP•5w ago
I've been thinking about how to do that. Right now I'm working on making sure it's isolated from anything else contributing to render times.
typical-coral•5w ago
something you could do immediately is share a screenshot from a performance audit in chrome running the queries
record it & then share the bottoms-up view
conscious-sapphireOP•5w ago
the react profiler one or the chrome devtools one
typical-coral•5w ago
chrome
that'll tell us what js functions are most active
conscious-sapphireOP•5w ago
woah. guess I need to do some youtubing on the performance tab. I've been trying to use the profiler and commenting stuff out.
conscious-sapphireOP•5w ago

jolly-crimson•5w ago
Could you expand the "Function Call" one test the top?
conscious-sapphireOP•5w ago
expanded the bigguns
conscious-sapphireOP•5w ago

jolly-crimson•5w ago
A lot those look like react internals.
Is
loadMatches something in your code?conscious-sapphireOP•5w ago
It is not.
jolly-crimson•5w ago
Are you using React router?
conscious-sapphireOP•5w ago
I'm seeing that 100ms is shaved off when I remove a hover drop zone. Using pragmatic drag and drop.
conscious-sapphireOP•5w ago
This seems to be the biggest problem. This is the 5th attempt and so far the best performance I've been able to get to get for "get related child collection primary keys for a given parent primary key": https://gist.github.com/evanheckert/3ff4f809f42766e60cf4f0974e1a142b
Gist
Get Related IDs for multiple entities
Get Related IDs for multiple entities. GitHub Gist: instantly share code, notes, and snippets.
conscious-sapphireOP•5w ago
and here's my silly sketch of the "need".

conscious-sapphireOP•5w ago
The actual UI and the ERD at the top of this thread in this post: https://discord.com/channels/719702312431386674/1431291621932273674/1431295391499817141
Basically just workarounds for the forthcoming
includes feature we've discussed (assuming I'm understanding that feature)
But that explains why the hover hook was 1/3rd of the time - because the hover zone needs to be aware of whether the picked up card is already present in itself.jolly-crimson•5w ago
What I'm a little confused about is that the trace is showing a total of 14ms inside useLiveQuey. Now this could be deceptive if there is some async work happing, so we need to dig into what's happening.
1. is this happing only on first load after a refresh or slated when navigating?
2. Are you using react router? it looks like most of the time is spent in a route loader if I am reading the trace correctly.
conscious-sapphireOP•5w ago
using Tanstack Router.
And it happens every time the searchParam
d changes (date string)jolly-crimson•5w ago
Are you preloading the queries in the router loader?
conscious-sapphireOP•5w ago
using electric, all data is already local
simply changing the
date part of the where function, and then the downstream data processing as in that gist.typical-coral•5w ago
Is this a production build?
conscious-sapphireOP•5w ago
vite dev. React Compiler enabled, though I haven't stripped my manual useCallback/useMemo calls yet.
jolly-crimson•5w ago
Could you wrap each useLiveQuery call in:
and post the full console log from a navigation?
Only wrap the useLiveQuery, not the processing code.
Also if you have any collection.preload() or liveQueryCollection.preload() in your router loaders wrap them too with named timers.
conscious-sapphireOP•5w ago
typical-coral•5w ago
Ok you should only do perf tests on production builds. React is wildly faster in prod
jolly-crimson•5w ago
Thanks, there are quite a lot of live queries there, do you think there are duplicates? So queries that are running multiple times when they should only run once?
useDispatchAssignedIds looks the slowest and run 13 time at the end. Is that expected for how you display things on screen?
conscious-sapphireOP•5w ago
useSelectedInstallerSameDayAssignments should be running 21 times but is running 96.jolly-crimson•5w ago
Ok, so that's indicating we are getting multiple rendered. As this is local dev you will likely have strict mode on, so everything runs at least twice (react strict mode is a bit frustrating)
conscious-sapphireOP•5w ago
got the totals:
jolly-crimson•5w ago
As Kyle said, worth doing the trace in a prod build.
conscious-sapphireOP•5w ago
yeah, building.
haven't accounted for that locally in the docker setup so will take a little bit.
jolly-crimson•5w ago
Thanks, worth doing that before digging further.
Once you do, if useDispatchAssignedIds is still the lions share check how many times it's called, and if that matches your expectation.
conscious-sapphireOP•5w ago
yeah, that one is running 13 times, once for each instance of a vehicle dispatch.
Alright, here's a production build. Diving into useDispatchAssignedIds to find a better approach:
jolly-crimson•5w ago
Are they still being run more times than you would expect?
As some are derived from others, they may be being rebuilt multiple times
conscious-sapphireOP•5w ago
two of them are, yes, but not the slow one.
-
useSelectedInstallerSameDayAssignments should be run once per installer per date, and there are max 21 installers, so 4.2x more than they should.
- useVehicleAssignedIds should be run once for each vehicle per date, of which there are 13, so 3.7x more than they should.
if a live query hook is called from two components but with the same exact two string props passed, useLiveQuery should only run once, correct?typical-coral•5w ago
Can you do a chrome profile?
jolly-crimson•5w ago
if a live query hook is called from two components but with the same exact two string props passed, useLiveQuery should only run once, correct?No, we only dedupe from a single useLiveQuery inside a component at the moment.
conscious-sapphireOP•5w ago
ah, okay. so the installer repeats are expected, then. vehicle one should be easily solvable - will do after chrome profile
conscious-sapphireOP•5w ago

conscious-sapphireOP•5w ago
sorted by total time

typical-coral•5w ago
Actually sort by self time
conscious-sapphireOP•5w ago

typical-coral•5w ago
Total time includes all functions that function calls
Can you click the arrow to open those first few? To see what they're part of
conscious-sapphireOP•5w ago

typical-coral•5w ago
Ok so that's d2ts so the join
conscious-sapphireOP•5w ago
next one

jolly-crimson•5w ago
Yep, a bunch of time inside the graph run.
I suspect is a combination of a complex query that's maybe not being optimised, and the live writes being recreated and rerun multiple times (if they is what's happening, although it may not be).
Includes will solve a bunch of this I suspect.
Plus we should look at deduping live queries that are identical.
conscious-sapphireOP•5w ago
Never want to be "that guy", but would you guess that includes are days, weeks, or months away?
typical-coral•5w ago
While difficult to tell, Sam is on vacation right now 😂
Maybe next week or the next
conscious-sapphireOP•4w ago
oh that's great news! And dang sam, hope I'm not taking away from your vacation with this stuff - I appreciate both of your help a ton.
What about indexes?
I see some reference to them in the API but no mention in docs, so not sure if that's a lever a dev can pull on a given collection to boost perf when we know it'll always be
where({ item } => eq(item.date, date))typical-coral•4w ago
indexes are applied automatically — what Sam is suggesting is your query is probably not using one now somehow — i.e. a bug
conscious-sapphireOP•4w ago
Should I create an issue?
typical-coral•4w ago
Sure yeah
typical-coral•4w ago
Thanks! Very helpful. It looks like we just aren't creating or using indexes on nested fields
https://github.com/TanStack/db/pull/728
GitHub
Fix GitHub issue #727 in TanStack DB by KyleAMathews · Pull Reques...
This fix allows auto-indexes to be created for nested field paths (e.g., profile.score, metadata.stats.views), not just top-level fields. This resolves performance issues where queries with eq(), g...
typical-coral•4w ago
@evan the PR above is published! When you try upgrading, keen to hear what the latest perf numbers are!
conscious-sapphireOP•4w ago
Just updated! Knocking out a quick bugfix elsewhere and then will go test it out!
Alright, so I had already used a workaround for the deduping issue using jotai atom family to store date-specific live collections to then run more granular useLiveQuery on within components, and that had gotten it down to about 80ms. So sadly I don't have a 1:1 comparison for before and after. But still getting all the same data.
So I just updated, refreshed, and did the console.time aggregations - and this is in dev still...
LOL 94% speed improvement Gonna go try it in a production build just for kicks.
Prod
typical-coral•4w ago
😂🥳🚀
Devtools output?
jolly-crimson•4w ago
Nice! 🔥