Metrics and monitoring - built-in solution / Prometheus - feedbacks
Hello,
I’m exploring ways to add metrics and monitoring to our application, ideally with Prometheus.
Is there any solution or guidance you can share for doing this in Gadget?
10 Replies
What kind of metrics and monitoring did you want to add? We might have docs on something similar but otherwise, I could try my best to point you in the right direction.
I wanted to monitor the routes and actions from start to finish, including the webhooks used to sync our contacts across different CRMs. Additionally, I’m interested in tracking the number of 4XX and 5XX responses over intervals for the routes and actions mentioned above.
Additionally, we need to assess our message sending capacity with Meta, measured in sends per minute
Ok, I don't think that we have anything built into Gadget that will directly help with this
I'm trying to scrounge up what you might need to do and I found this: https://github.com/siimon/prom-client
Not sure if you'd come across that yourself
I think that you'll need to use something like the fastify-metrics as a boot plugin
Or even @dnlup/fastify-doc
Here are the boot plugin docs: https://docs.gadget.dev/guides/http-routes/route-structure#boot-plugins
Hopefully that puts you in the right direction
Thanks Antoine I will do some try 🙂
Let me know if you need more help!
Sure, thanks. it is the evening here, I will try tomorrow morning 😋
Ok I already use prom-client on another project, I will continue with this lib 🙂
hey it is me again! 😄
We've deployed the application endpoint, but the returned values appear to be instance-dependent. Is there an environment variable or configuration value that can be used to provide a unique identifier for the current container instance?
Could you please explain the need a little further? I would like to understand further so that I can better assist you
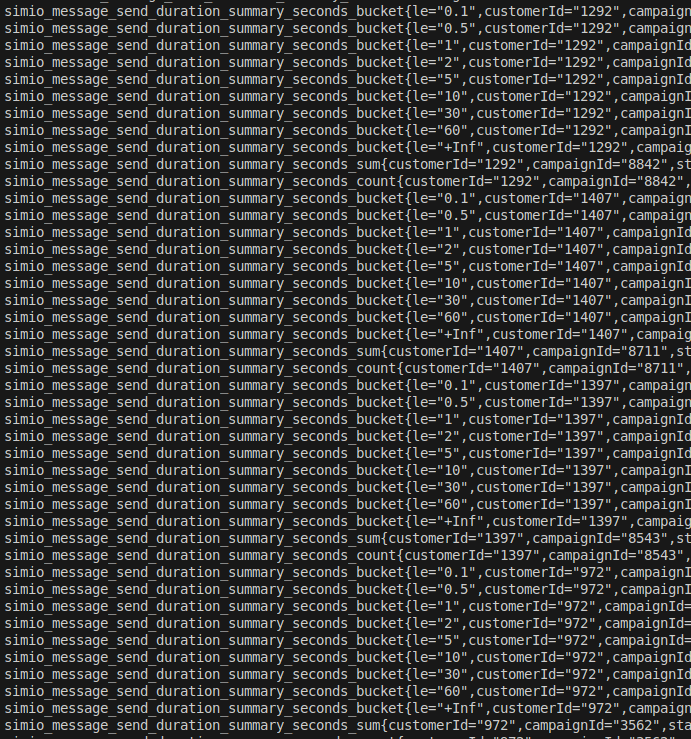
The production metrics endpoint (for WhatsApp campaign stats like mean time, remaining messages) is serving inconsistent data.
I get different results every time I cURL the endpoint, it seems to be exposing metrics from different running instances on each call, preventing reliable monitoring. At a moment the result in attachment comes back!

So it looks like that is serving data from the sandboxes. you will have multiple pods running there, each tracking their own metrics it looks like. I think there are a few tweaks you could do:
1. add process.env.K8S_POD_NAME to the metric labels, that will be a unique identifier to help consolidate metrics
2. to handle the inconsistent data, you may need to persist the data to a model, roll it up, and send it to prometheus with a background action.
is there a reason you need to use the api to read and report the metrics? is it possible to make the metric reporting happen after a message is sent?
Some other options include using
@sentry/react for tracing, and adding stats onto span attributes. We have other users who use this pattern.Hello Kirin, sorry for the late reply.
Thanks, I’ll try with the new label.
We have a lot of traffic so I wanted to avoid sending the metric after a message.
Regarding Sentry, the endpoint metrics are not very relevant. With the metrics coming from Prometheus, we can visualize what we need in a grafana dashboard.