Trying to Understand CPU Time
📄Logs Workers
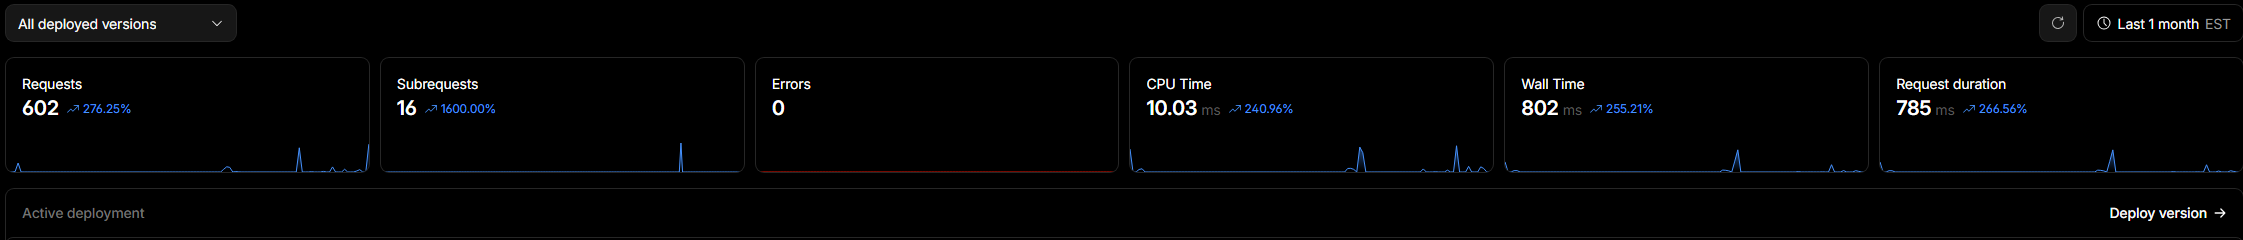
WorkersI am relatively new to Cloudflare and am trying to get an understanding of worker metric breakdowns. I have these metrics over the past month:
Requests - 602
Subrequests - 16
CPU Time - 10.03ms
Wall Time - 802ms
Request Duration - 785ms
I noticed CPU Time is 10.03ms and am wondering if this is the CPU Time Per Invocation or if it is total? If this is per-invocation, will I be billed for each request?
More details for context:
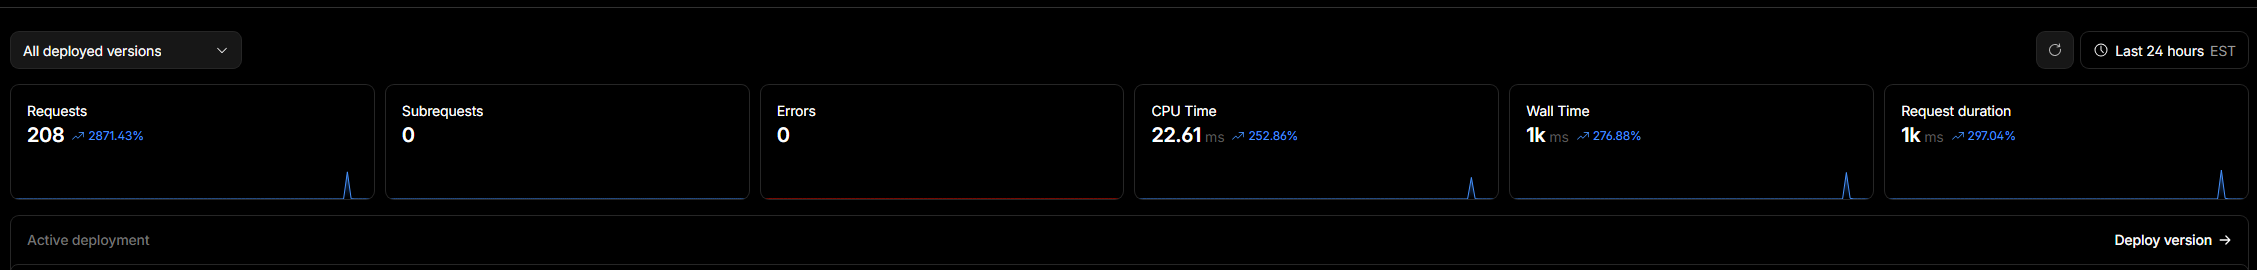
The Overview metrics are showing for the last 24 hours
Requests - 208
CPU Time - 8.43ms
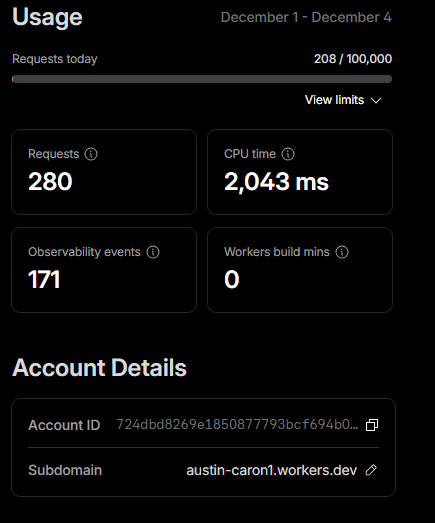
When on the Workers & Pages page, the Usage from December 1 - December 4 shows
CPU Time 2,043ms
And then strangely when I go into the Metrics section and choose Last 24 Hours, it shows my CPU Time to be 8.43ms and then jumps to 22.61ms
Obviously I'm well under the requests amount, but I am very confused as to how the CPU Time works and if I'm over the free tier amounts or not. Thank you anyone for the help!
Requests - 602
Subrequests - 16
CPU Time - 10.03ms
Wall Time - 802ms
Request Duration - 785ms
I noticed CPU Time is 10.03ms and am wondering if this is the CPU Time Per Invocation or if it is total? If this is per-invocation, will I be billed for each request?
More details for context:
The Overview metrics are showing for the last 24 hours
Requests - 208
CPU Time - 8.43ms
When on the Workers & Pages page, the Usage from December 1 - December 4 shows
CPU Time 2,043ms
And then strangely when I go into the Metrics section and choose Last 24 Hours, it shows my CPU Time to be 8.43ms and then jumps to 22.61ms
Obviously I'm well under the requests amount, but I am very confused as to how the CPU Time works and if I'm over the free tier amounts or not. Thank you anyone for the help!

Welcome to the official Cloudflare Developers server. Here you can ask for help and stay updated with the latest news
86,942Members
Resources
Similar Threads
Was this page helpful?