Stock price graph incorrect (when compared to price)?
🐛Bug✅Solved
I am trying to configure Stock Price widget and using 1 day / 5 minutes to see the last day changes.
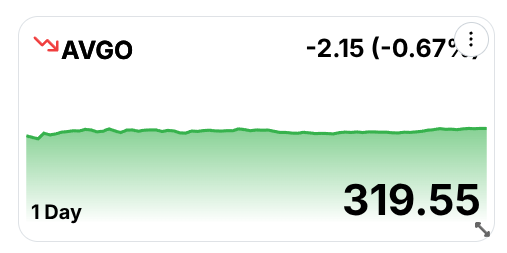
However, when testing with some stocks, I noticed the following: the graph appears as green (up) but the actual price is down -2.15/-0.67% (this is AVGO stock).
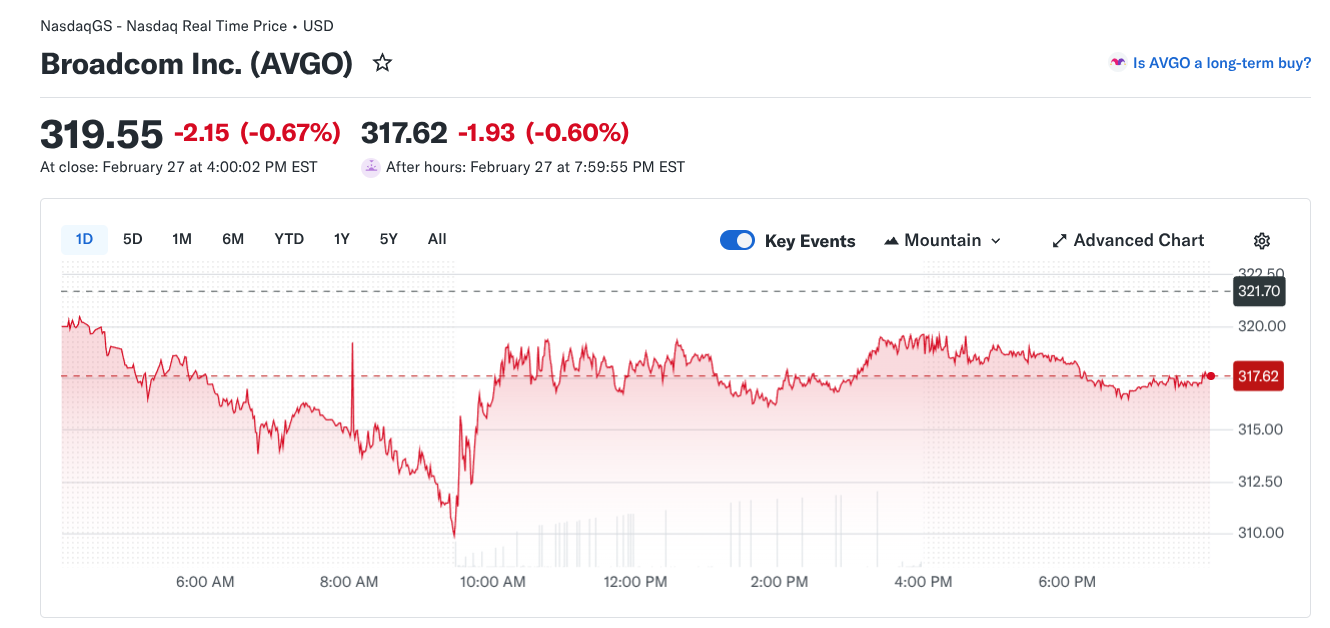
I have seen a previous fix in this area (https://github.com/homarr-labs/homarr/issues/4670) related to the price/percentage (the price/% looks good to me), but the graph data may not be correct, unless I am doing something wrong.
My expectation is that the graph and price change data time range are showing the same period, or there should be an option for this.
Is this an expected bug?
I am using Homarr 1.54.0 on Docker.
However, when testing with some stocks, I noticed the following: the graph appears as green (up) but the actual price is down -2.15/-0.67% (this is AVGO stock).
I have seen a previous fix in this area (https://github.com/homarr-labs/homarr/issues/4670) related to the price/percentage (the price/% looks good to me), but the graph data may not be correct, unless I am doing something wrong.
My expectation is that the graph and price change data time range are showing the same period, or there should be an option for this.
Is this an expected bug?
I am using Homarr 1.54.0 on Docker.
GitHub
Describe the bug Using the Stock Price item and see that the change amount and the percentage appear to be incorrect? Using the ^DJI ticker, I see in the Stock Price App that it shows the correct e...