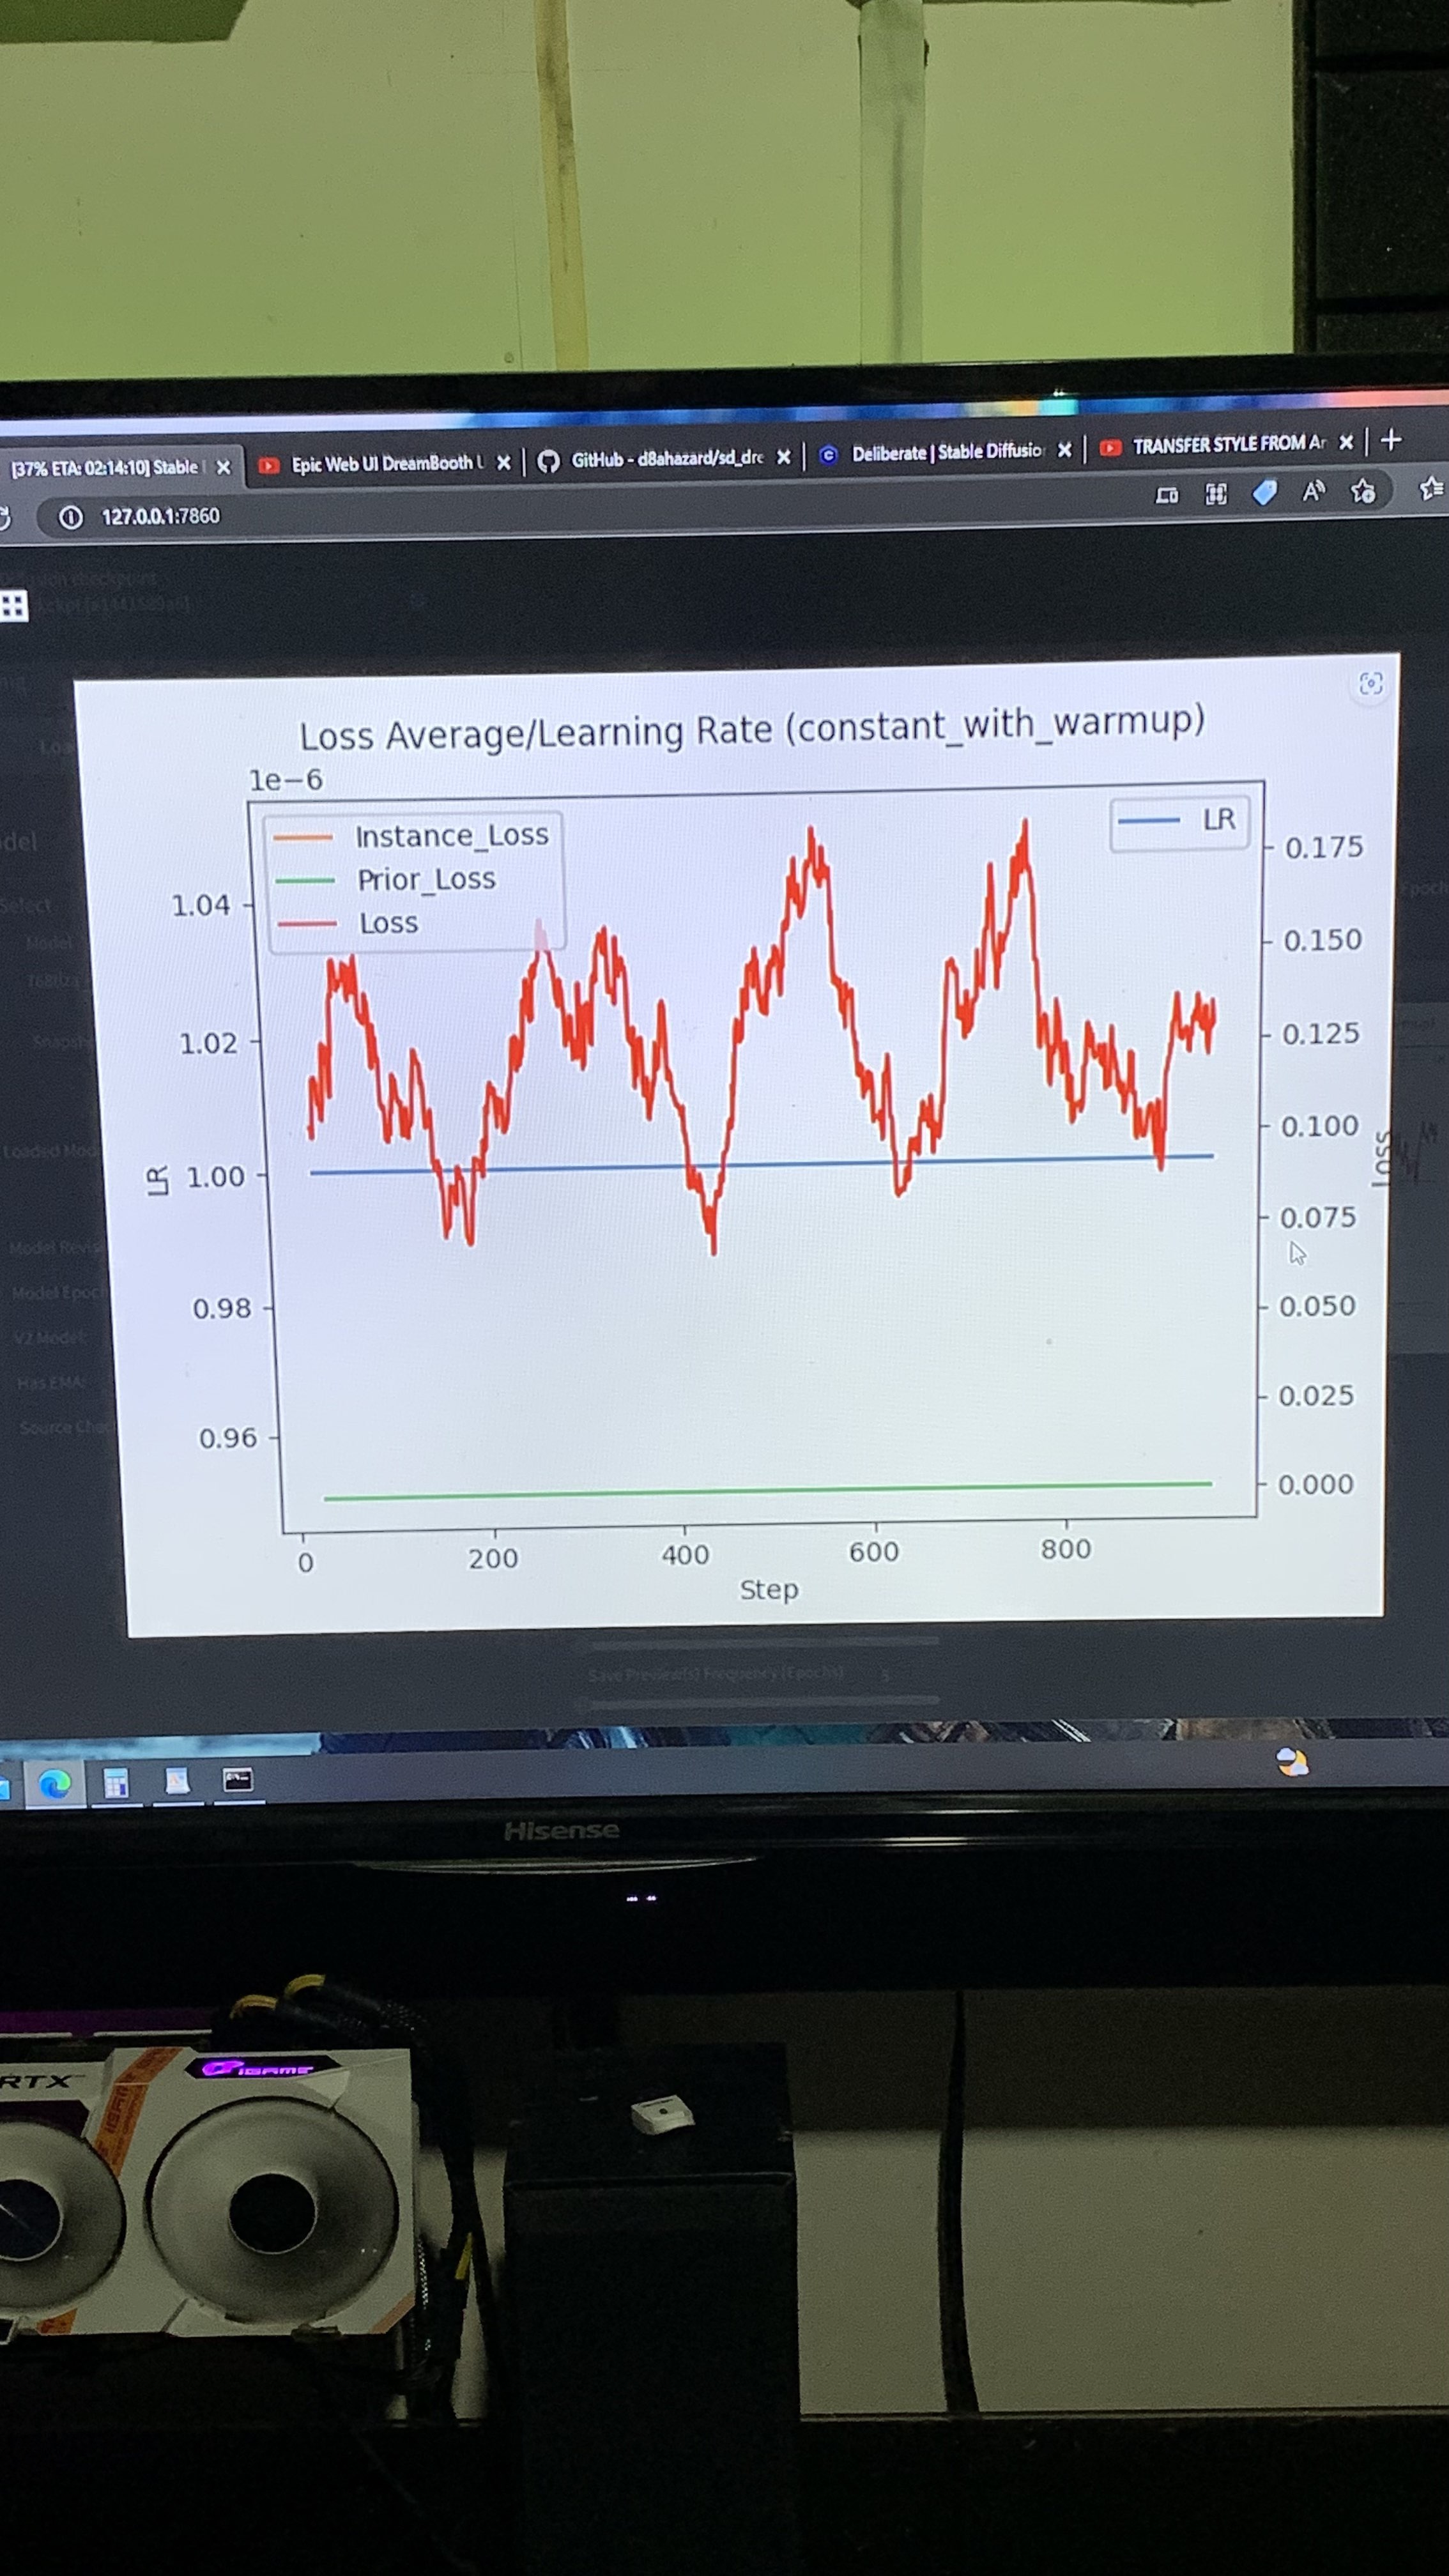
We need to understand how this Loss avg/Learnrate represents. This grap shows red waves above thrsho
We need to understand how this Loss avg/Learnrate represents. This grap shows red waves above thrshold on LR 1. Can you help us understand what these all about?