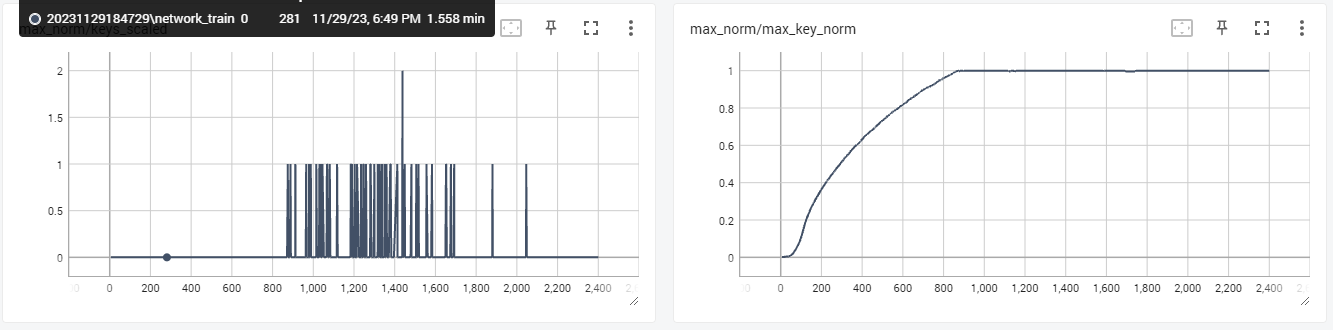
These graphs are only displayed when normalization is enabled for Lora (it is not enabled for DB). B
These graphs are only displayed when normalization is enabled for Lora (it is not enabled for DB). Based on the developer's description, I watch these two values to see if the maximum normalization reaches 1 (it is supposed to be good then) or not over normalizing, so how much it deviates from the original model, how much Lora needs to be improved. And from my observations, for cosine type training, these two graphs give very useful results under Prodigy.


![Digital [Starburst]](https://cdn.discordapp.com/avatars/220961909447458817/8ecbbb3132fc6e44312f3d6d2ae3df69.webp?size=40)