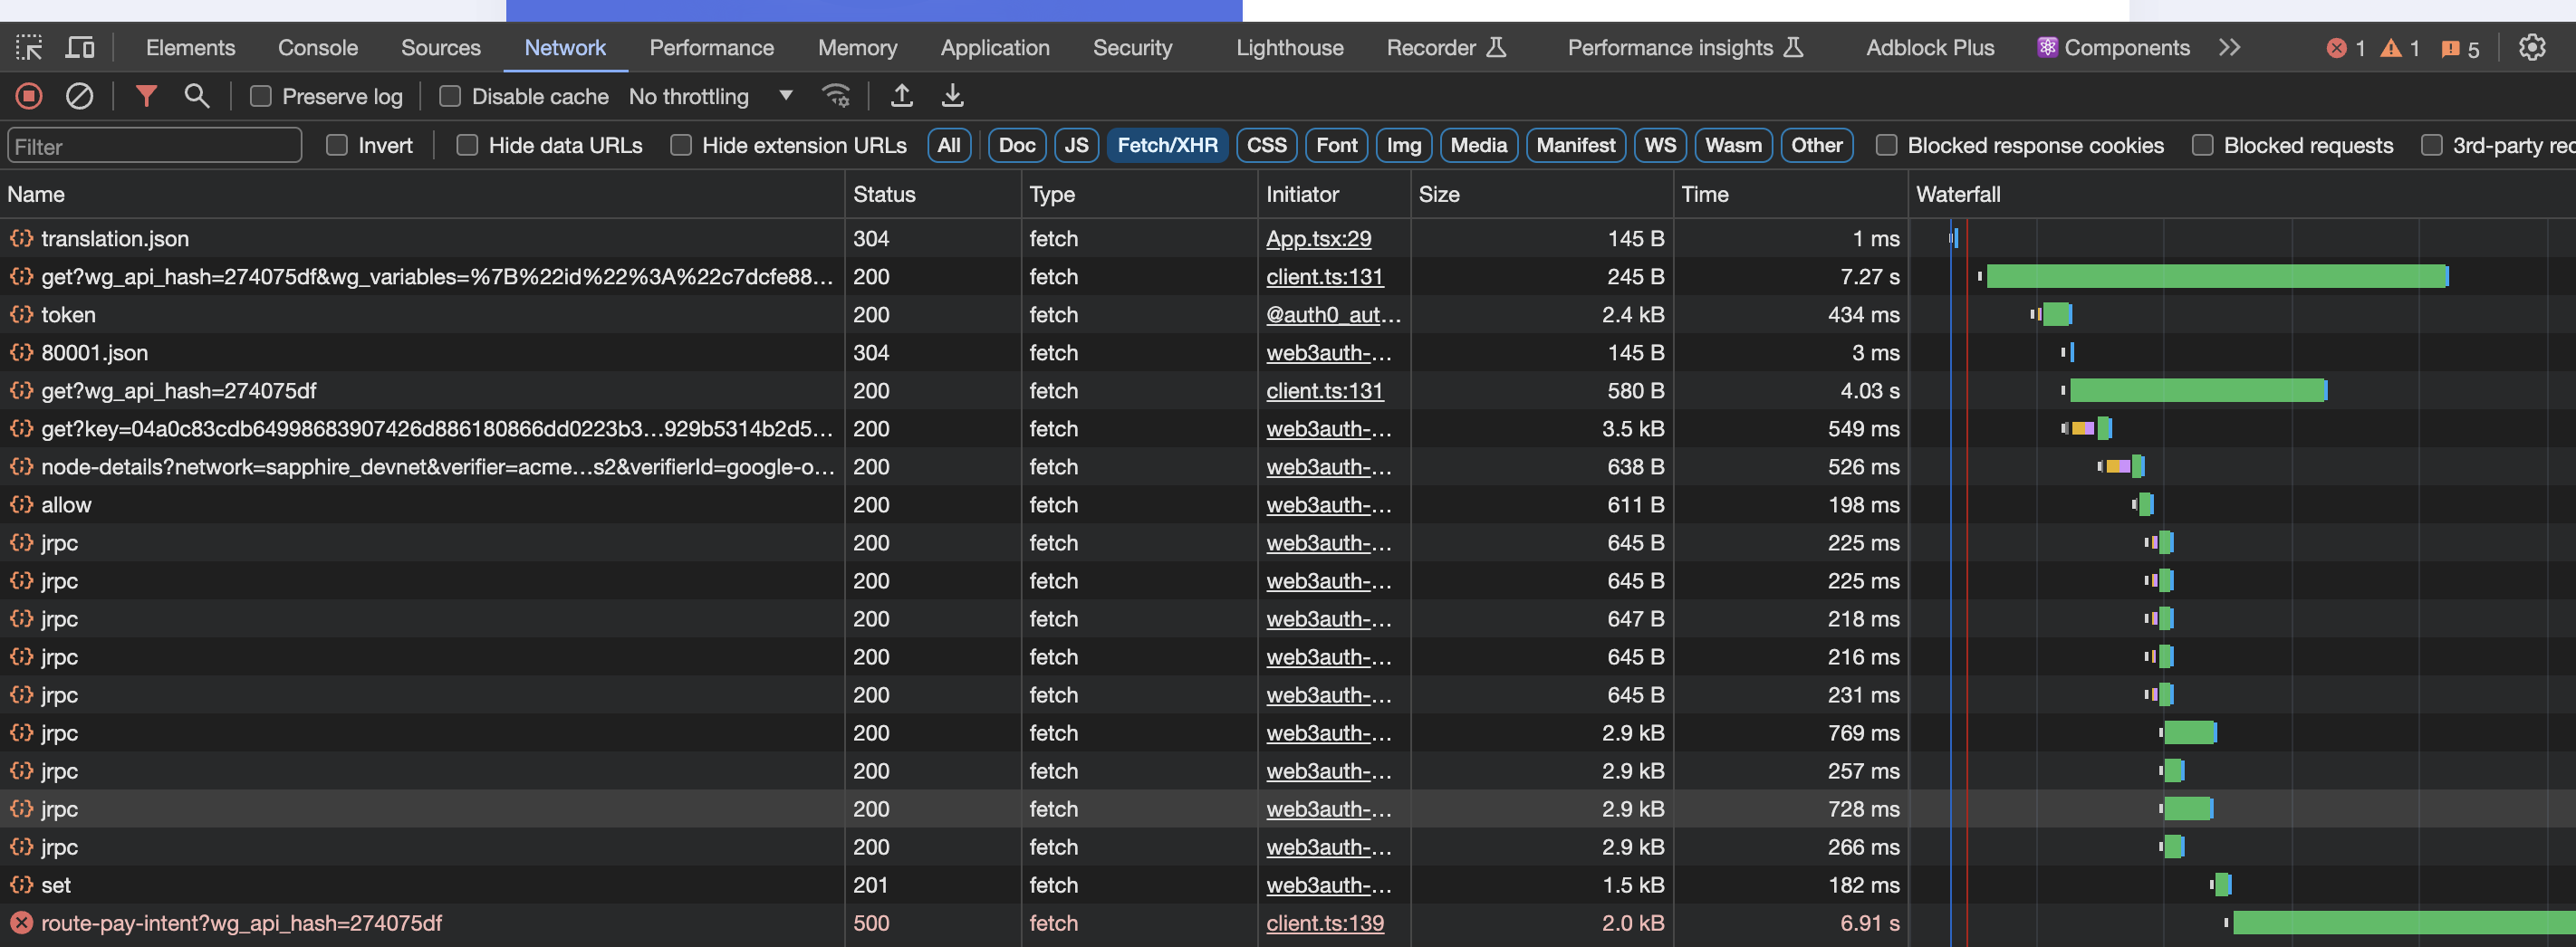
DB loads insanely slow
Hello, we’re using wundergraph + neon and noticing load times of up to 7 seconds for a simple query. We are on the free plan as we’re testing things out but is it really supposed to be this slow?

34 Replies
stormy-gold•2y ago
Hey Niles - have you run an
EXPLAIN ANALYZE on your query?conscious-sapphire•2y ago
On top of the suggestion by @Mike J , try running the same queries in the SQL editor or via
psql vs your application to rule out an application-level bottleneck.rival-black•2y ago
Hi there, how everyone is going?
We noticed those delays even executing some simple queries to the db from pgadmin.
5 seconds to execute a query to a table with only one row.

rival-black•2y ago
This are the Neon instance details:

passive-yellowOP•2y ago
Thanks @rpintos@spacedev.io -- @ShinyPokemon @Mike J, let us know if you need anything else
rival-black•2y ago
This is an other example it took 6 seconds. Executing this several times it takes from 1.5 secs to 6 secs

conscious-sapphire•2y ago
1. Was the query issued against an idle endpoint? In other words, does this only happen on a cold start, or is it consistently slow even if issued again and again?
2. Does
EXPLAIN ANALYZE provide any insight?
3. Are you located far from US-east?
4. Feel free to share your project ID so we can test on our end, and see if this requires deeper investigation.rival-black•2y ago
1. Yes, seems to be in a cold start. Could we have a minimum set of instances awake to prevent that cold start?
2. Will check
3. We are in shout america (Uruguay/Argentina)
4. Sure, https://console.neon.tech/app/projects/tiny-sound-92403171 > tiny-sound-92403171 is the id right?
conscious-sapphire•2y ago
Yep. That is the ID! Ok I think the geography combined with cold start is the issue. You can disable auto suspend to avoid cold starts. This will increase your compute cost, so you might want to do it only on your primary (production) branch, and not dev branches
https://neon.tech/docs/guides/auto-suspend-guide
Neon
Configuring Autosuspend for Neon computes - Neon Docs
Neon's Autosuspend feature controls when a Neon compute instance transitions to an Idle state (scales to zero) due to inactivity. This guide demonstrates how to configure the autosuspend setting in yo...
rival-black•2y ago
Ok let me read this and I come back later. Thx!
passive-yellowOP•2y ago
@ShinyPokemon -- Any chance you could help a small startup like ours with some credits to bootstrap Neon into our stack? 🙂 We have $5K in Mongo credits, but would really like to use you guys moving forward
conscious-sapphire•2y ago
DM-ing you.
extended-salmon•2y ago
@Niles @rpintos@spacedev.io
Could it be that the slow insert was experienced around
2024-01-24T05:02:24.60551 UTC and 2024-01-23T16:51:09.573237 UTC? At those timestamps, I observe that your endpoint couldn't start from the pools. Instead of the usual 125-250ms coldstart, you experienced a cold start of 5857ms and another one of 7387ms. As described in our blog post Cold Start Just Got Hots (See: https://neon.tech/blog/cold-starts-just-got-hot) , to reduce the cold start duration, it was decided to maintain pools of already started "empty" compute endpoints. When a customer request comes in, we reconfigure one of those already started compute endpoint and provide it to the customer, allowing us to fulfil the request on average in less than 500ms. The real startup duration of the empty compute endpoints is actually longer than this and can take up to a few seconds. When those pools are exhausted, the compute endpoint will start as soon as the request is received, and in this case, the cold start duration will correspond to the normal startup duration of the compute endpoint, which is the problem that you experienced at the timestamps provided above. I will bring this point to the attention of our engineering team and will request an increase in the pool size, which should resolve the problem immediately.
Neon
Cold starts just got hot - Neon
tl;dr> Over the past few months, a bunch of efforts by the engineeringteam have greatly reduced our “cold start time” for compute resourcesfor idle computes that become active. This post explores the problemand how the Neon team worked on this problem. Background: What’s a cold start and why does it matter? Let’s get one thing […]
extended-salmon•2y ago
(I confirm that the relevant pool size was increased 🤗 )
rival-black•2y ago
Hey hey @Yanic. Thx for all this explanation.
Regarding the slow experience, it was mostly everytime.
Now I have tried several queries and it has improved a lot, so thx for that 🙌 .
We also think that once we deploy our server in US, we are gonna have even much better throughput.
extended-salmon•2y ago
I'm glad to read that the performance improved!
If you observe a reoccurrence of this issue, please capture the timestamp and feel free to ping me.
I would be happy to dig into our logs to help you 🙂
passive-yellowOP•2y ago
Thanks @Yanic -- you guys are awesome!
Hey @Yanic @ShinyPokemon -- we upgraded to the "Pro" plan and are still observing extremely slow loading times for basic queries and mutations
The Project ID is flat-term-59420511
passive-yellowOP•2y ago

passive-yellowOP•2y ago
We are seeing times of 10-11 seconds for basic queries
passive-yellowOP•2y ago
@Yanic @ShinyPokemon -- we maxed out the CPU to 7 and deactivated sleep mode and it still takes 2 seconds for basic queries


passive-yellowOP•2y ago
5 seconds for a basic mutation and 3 seconds for a basic query

passive-yellowOP•2y ago
These times are not feasible for us and I'm afraid we have to look at other options if this is Neon's maxed out performance
conscious-sapphire•2y ago
1. It looks like you changed the “default” compute size for new computes. Make sure you change it for your existing main branch compute by following the “Edit a compute endpoint” guide here https://neon.tech/docs/manage/endpoints
2. Looks like you’re showing an API response time screenshot. How long does the query take to execute in the SQL Editor in the Neon Console? That will give you a more realistic indication of whether the issue is with your backend, or the database.
Neon
Manage computes - Neon Docs
A single read write compute endpoint is created for your project's primary branch, by default. To connect to a database that resides in a branch, you must connect via a compute endpoint associated wit...
extended-salmon•2y ago

extended-salmon•2y ago
In the past, when you faced cold start issue, those numbers reached up to 7 seconds in comparison.
So, at the moment, you're not facing any coldstart issues
two questions:
1) are you using prisma?
2) are you using a pooled connection?
If the answer to both question is yes, do you by any chance have "pgbouncer=true" in your connection string?
Coldstarts are irrelevant for the project 'flat-term-59420511', the auto-suspend being disabled
This being said, I believe that you massively overprovisioned your endpoint
which eventually will translate into unecessary costs for you.
Till ~2PM UTC, your endpoint was configured with 1/4 of CU (1vCPU and 1GB of mem)
Here are the utilisation charts for this EP when running 1/4CU
extended-salmon•2y ago


extended-salmon•2y ago
at 2PM UTC, you bumped up the config to 7 CU for this endpoint (7vCPU and 28GB of mem)
extended-salmon•2y ago

extended-salmon•2y ago
It seems that you slightly increased your workload as well, the mem consumption peaking to nearly the double of the previous consumption
but even though, you're only using a tiny fraction of the computing ressources available
the contention is clearly not on CPU or memory side
extended-salmon•2y ago


extended-salmon•2y ago
The cache hit ratio is constantly at 100%, meaning that the slowness observed isn't caused either by disk access or network operations to retrieve the data from the pageserver or the cold storage
extended-salmon•2y ago
A (very) quick parsing of the logs for this endpoint also shows that this endpoint is massively over-provisioned for the workload running:

extended-salmon•2y ago
Honnestly, I would suggest that you reduce the number of CU allocated to your endpoint at the earliest.
The problem experienced is clearly not caused by either cpu or mem contention.
I'm happy that you spend money using our services, but at the moment I feel that you are wasting money and resources, which is not what I would qualify as a nice customer experience.
Can you please ping me in DM:
1) your connection string
2) a precise timestamp at which the slow query was experienced
3) if possible, a debug log, or any kind of applicative logs at your disposal
I will raise a support case on your behalf and I will dig in our logs to clarify where the problem comes from
But to be clear: the behaviour reported is NOT normal and we absolutely can do (much) better than this!
conscious-sapphire•2y ago
You’re a star Yanic!
I caught up with the guys at SpaceDev and it looks like Neon’s returning responses in about 2ms. Their database and application regions are different, so that’s adding overhead. They’re going to change region and dig into the application layer some more.