Scales of digital brains - video idea
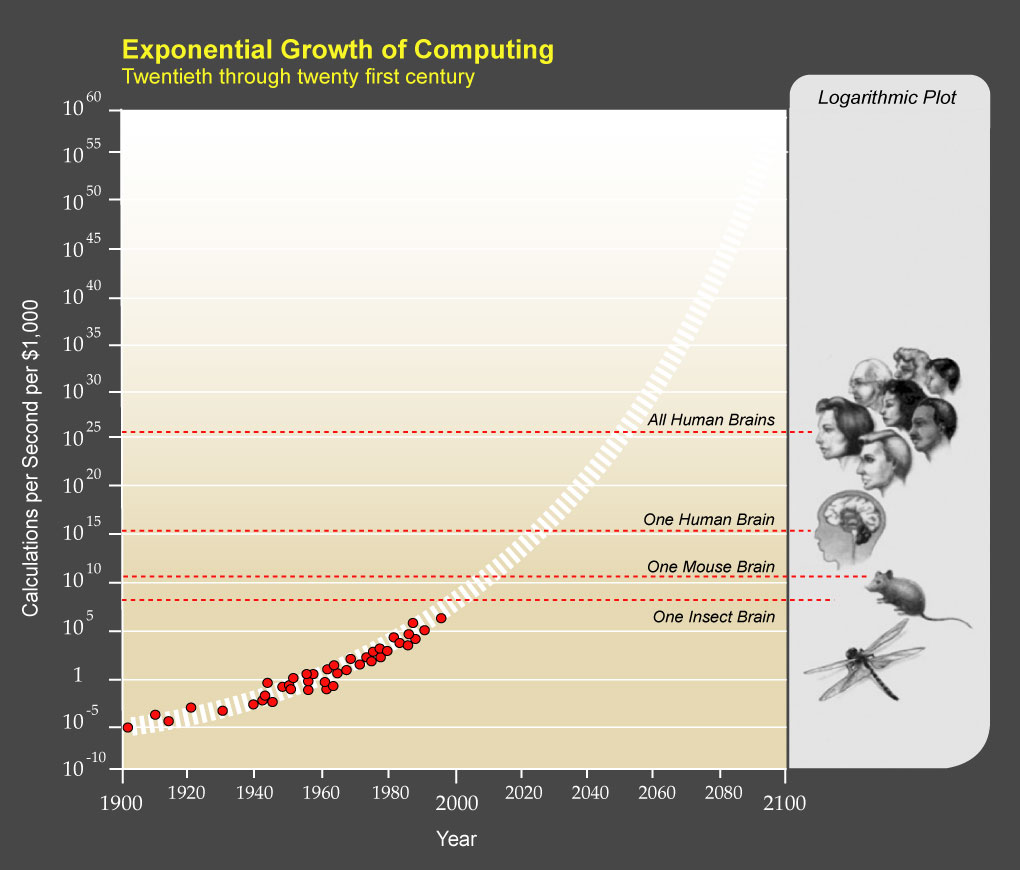
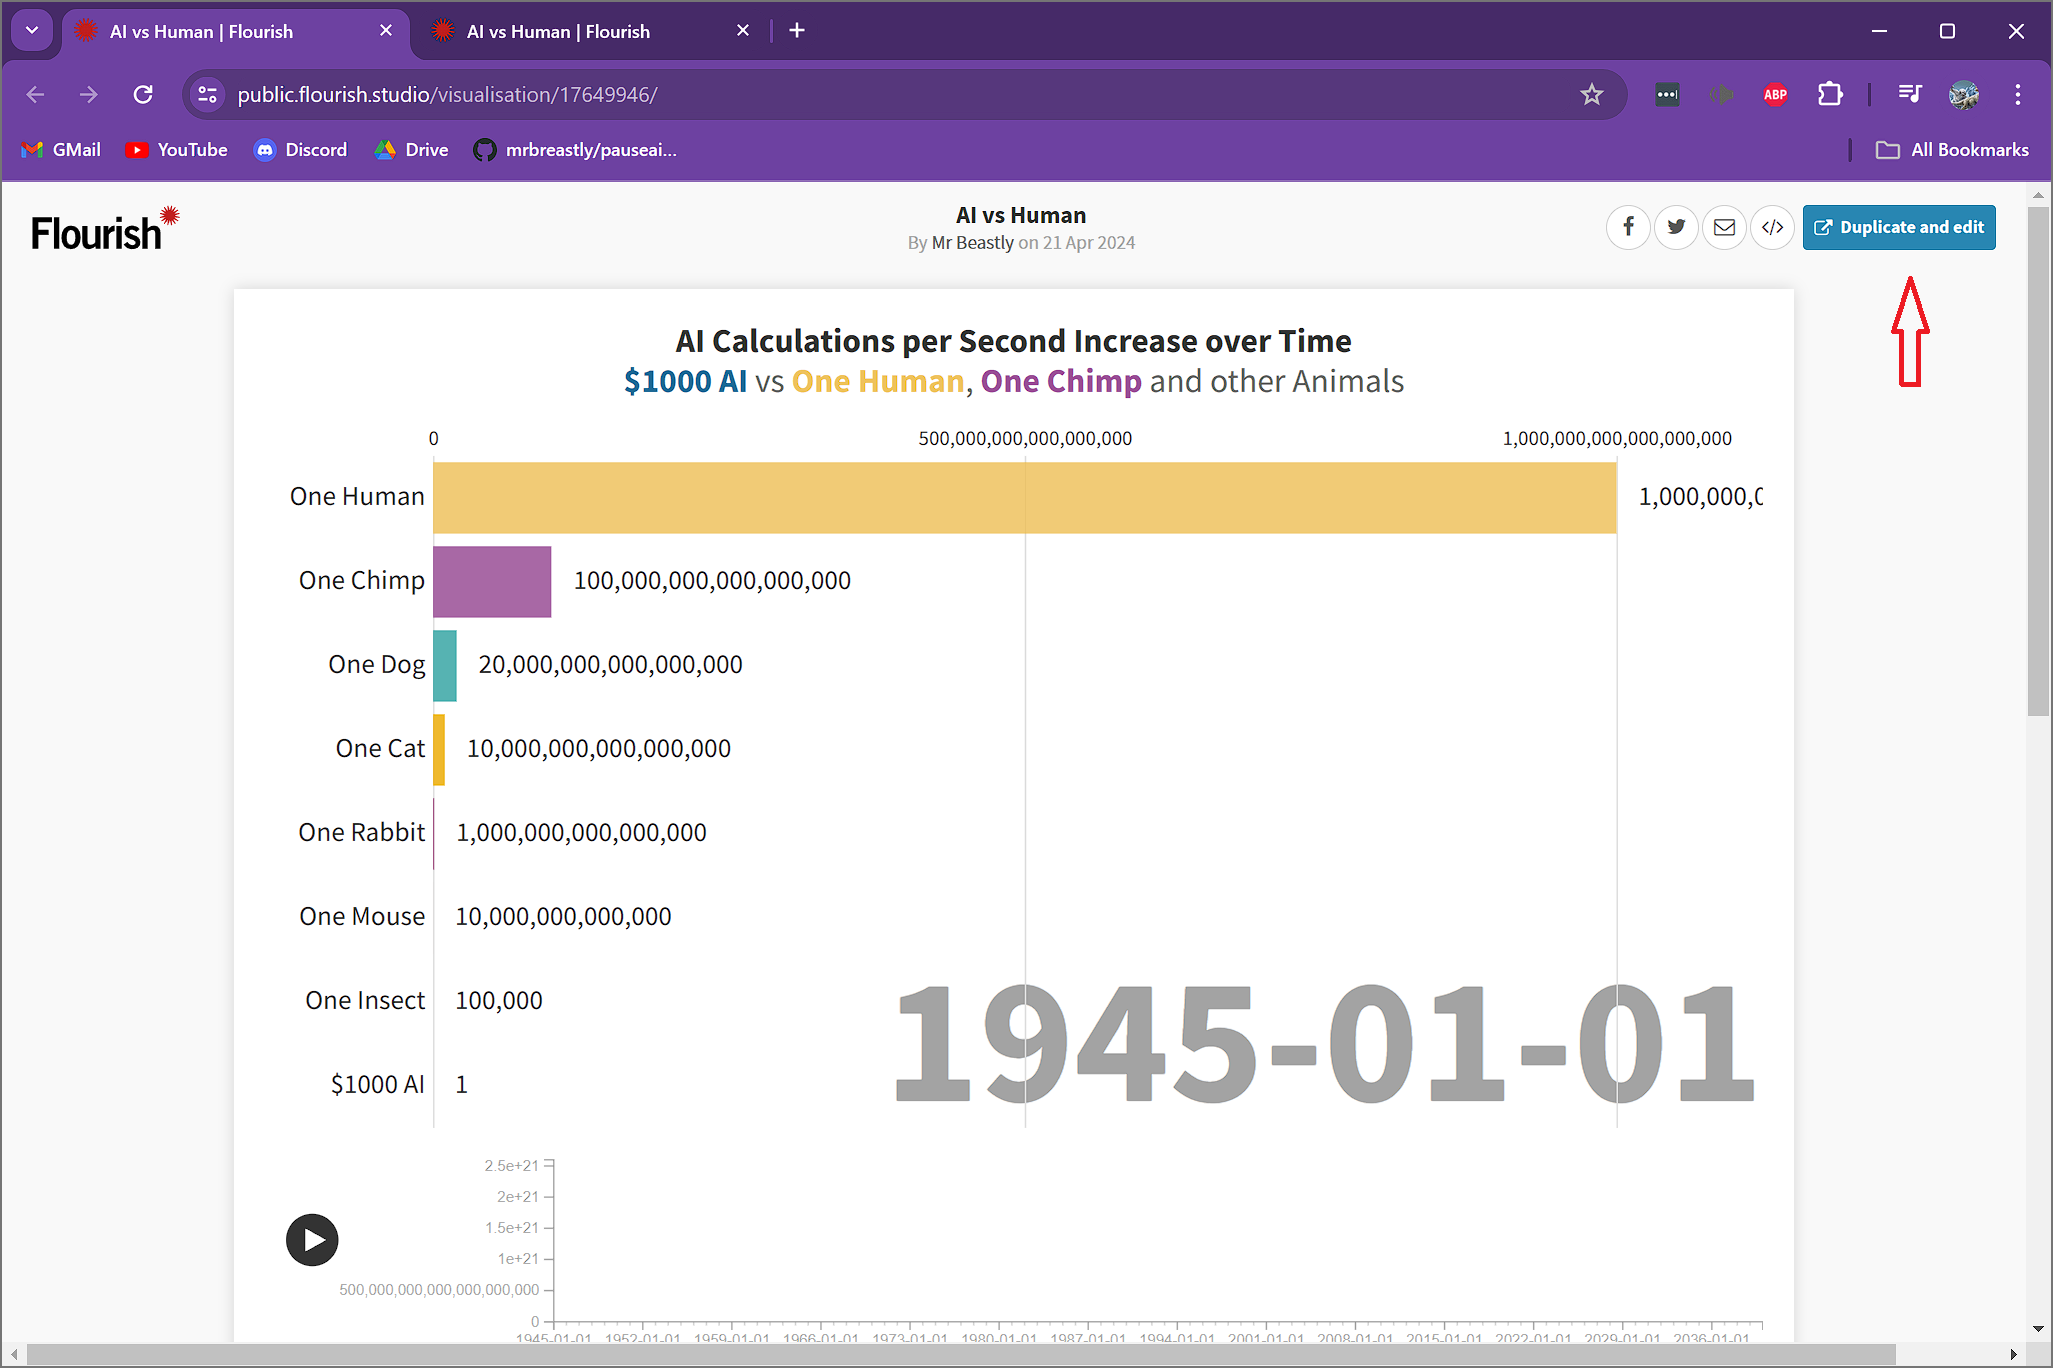
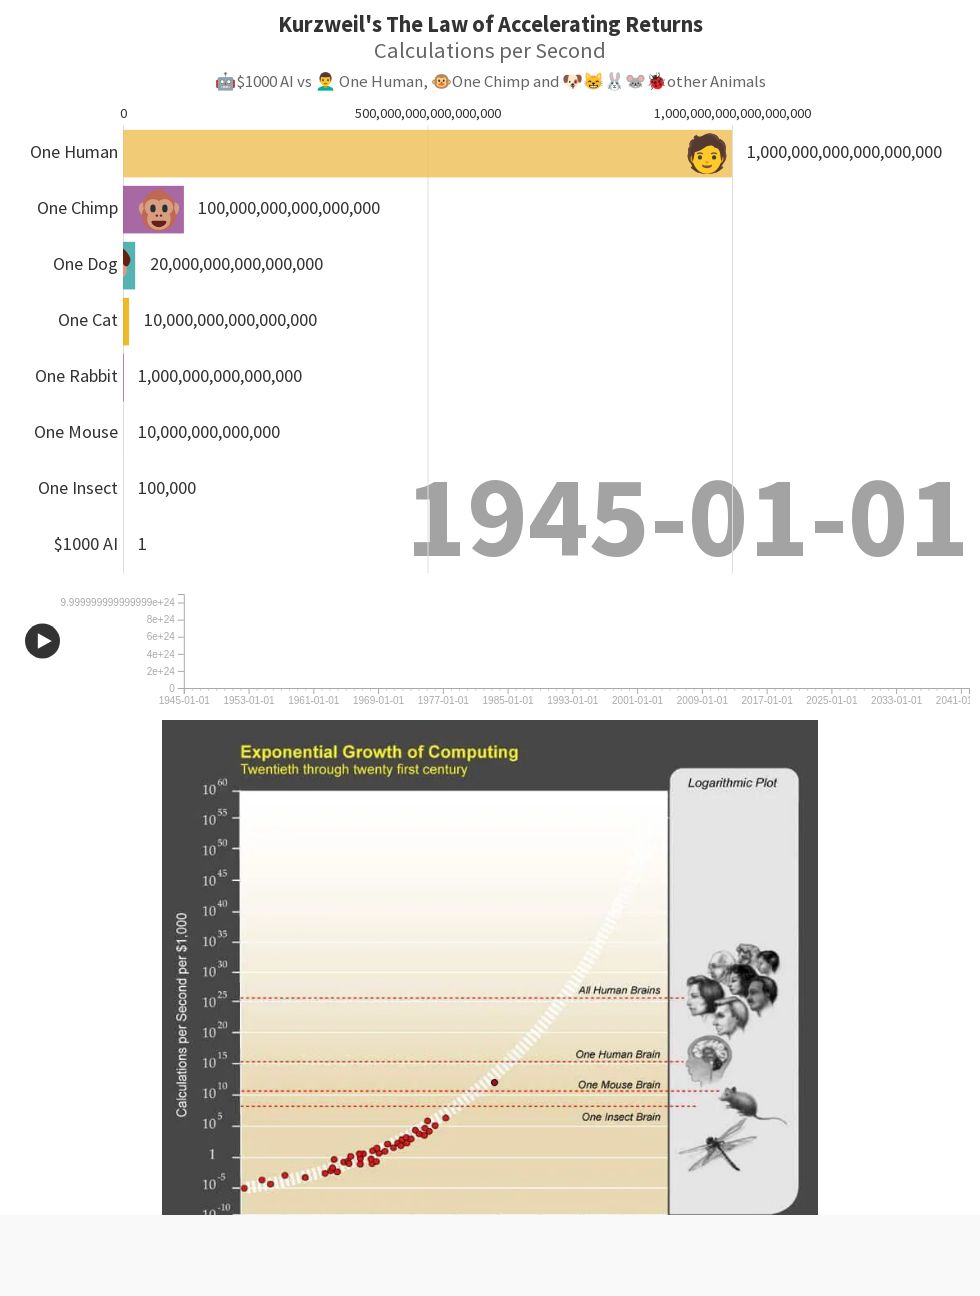
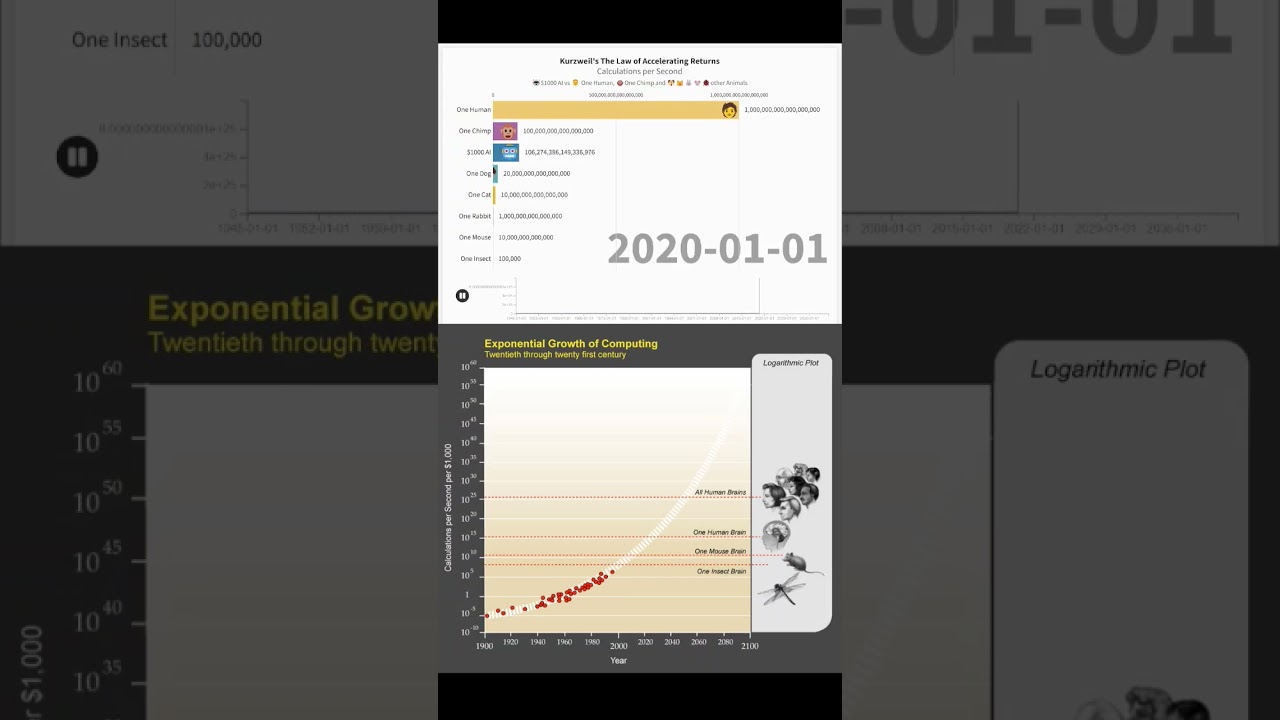
I want to visualize how large AI models are getting by comparing them to organic brains. I think this could work pretty well as an infographic or video short. We can of course end with a Hinton quote about the control problem.
How you can help
- How should we start the video? What's the best way to grab attention? First seconds matter a lot!
- How should the thumbnail look?
- How do we explain the relation effectively without diving into the details?
- Relation between synapses and parameters.
- Relation between neuron count
- Jellyfish, 6K neurons,
- Honey bee, 1M neurons, 1B connections https://linkinghub.elsevier.com/retrieve/pii/S1364661300016016
- Frog, 16M neurons,
- Mouse, 70M neurons, 1T connections https://pubmed.ncbi.nlm.nih.gov/16880386/
- Human, 100B neurons, 100T connections
- ResNet50: Image recognition (for tumors), 25M params, https://datascience.stackexchange.com/questions/73944/number-of-parameters-in-resnet-50 (
- Stable Diffiusion, 900M / 1B parameters (bee level)
- GPT-3, 175B parameters, (FROG LEVEL)
- GPT-4, 1.8T parameters https://the-decoder.com/gpt-4-has-a-trillion-parameters/ (MOUSE LEVEL)