Unable to turn on pg_stat_statements
Hi
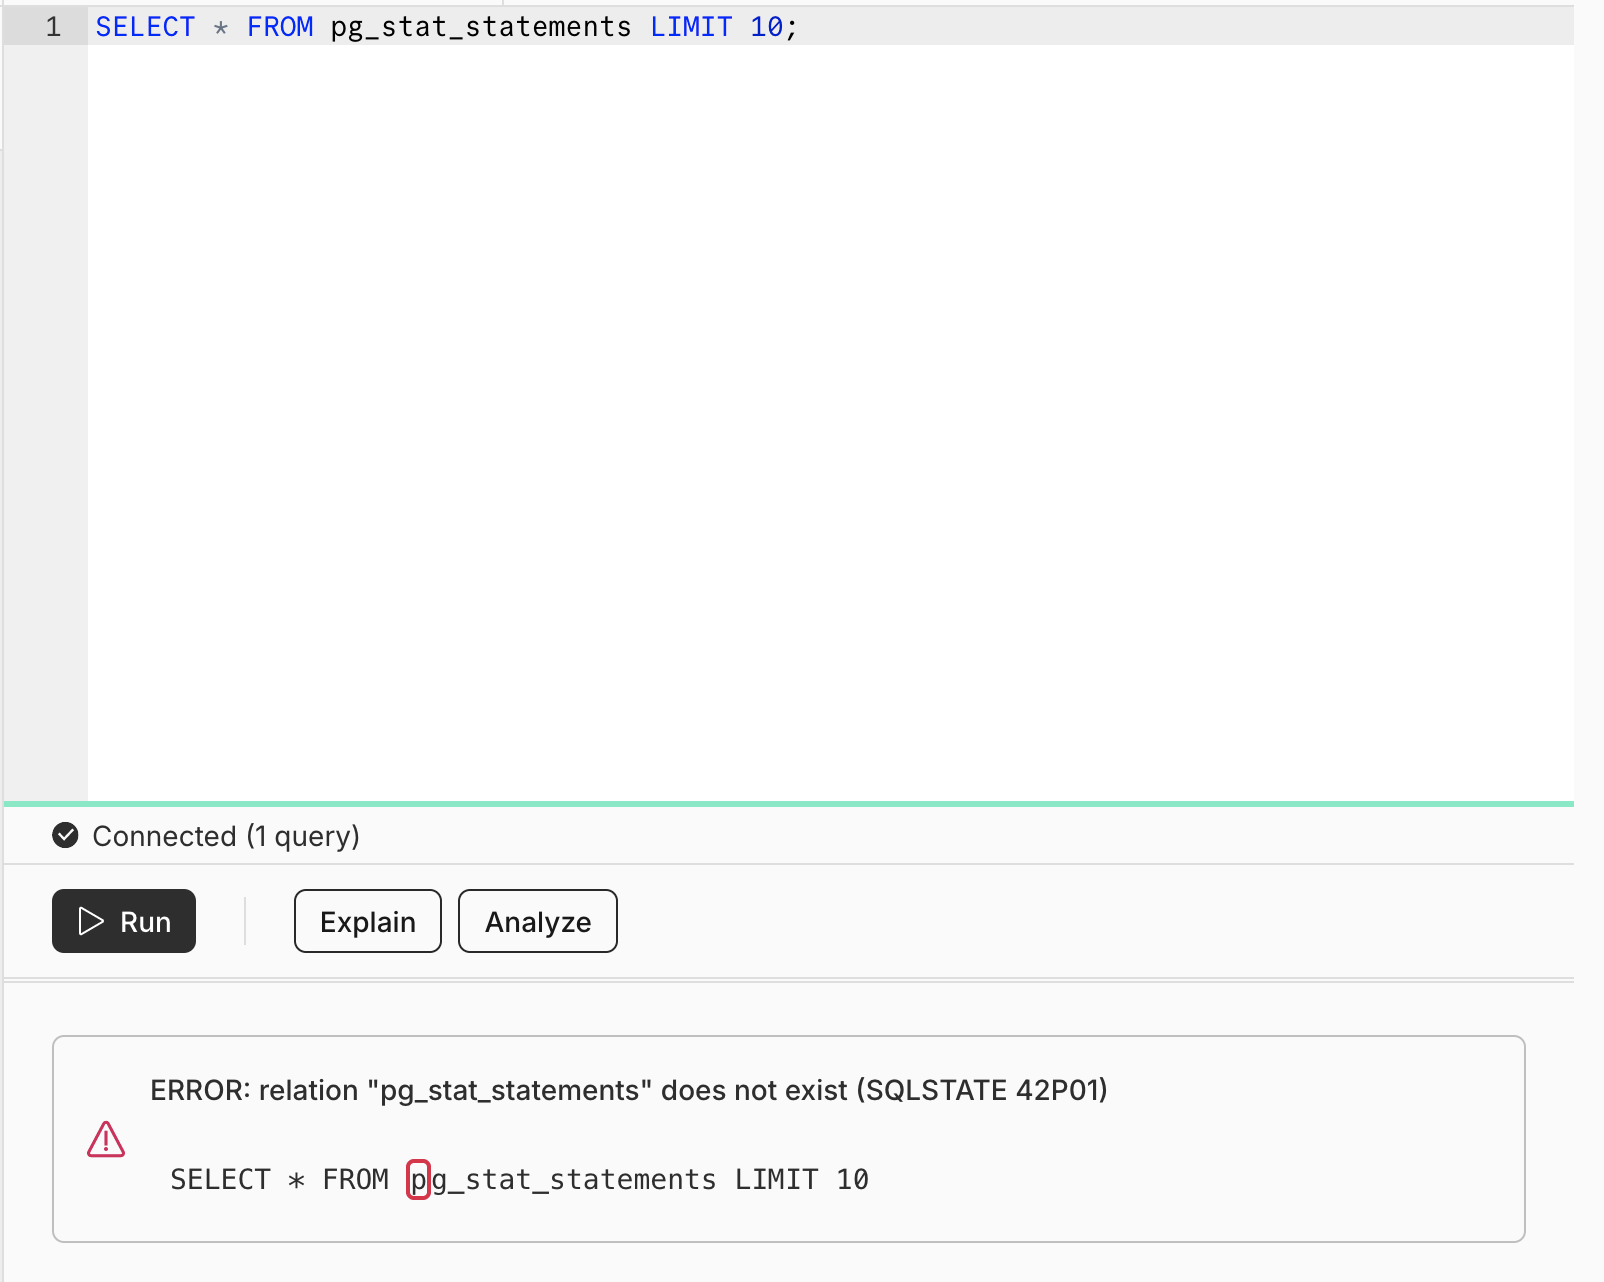
I am following the instructions in the neon guide here: https://neon.tech/docs/extensions/pg_stat_statements to enable pg_stat_extensions. Enabling the extension works without a problem but if try any queries listed in the instructions I get a "relation does not exist error".
Neon
The pg_stat_statements extension - Neon Docs
The pg_stat_statements extension provides a detailed statistical view of SQL statement execution within a Postgres database. It tracks information such as execution counts, total and average execution...

18 Replies
deep-jade•15mo ago
Hmm, the instructions work for me. Are you still running into this issue?
conscious-sapphireOP•15mo ago
@Mahmoud Yes still getting the same error.
The install instruction works but none of the queries work.
The reason I need to enable this is we are experiencing significant connection pool timeout and db connection errors with that particular Neon db and we have been pulling our hair out trying to figure out what is going on (it doesnt happen when we switch to the RDS alternative we have). So we are trying to figure out if there are any long running /broken queries on this instance (we have restarted compute etc but no avail)
@Mahmoud ok this is super interesting! The db that we are experiencing significant issues with (ie the issue above and connection issues) does not run these pg statement commands (that is project raspy-term-40530506)
I have just tried with a different project (shy-rice-20262973/) and these commands work.
The pg_statement thing has now resolved itself.
deep-jade•15mo ago
Glad to see that the issue is resolved! Not sure why you ran into an issue in the first place 🤔
Feel free to reach out if something like this happens again
conscious-sapphireOP•15mo ago
I dont know whether restart compute or uninstalling the uninstalling and re-installing the extension did the trick.
deep-jade•15mo ago
restart computeThis could be it, yea
conscious-sapphireOP•15mo ago
I restarted it a couple of times before so not sure that was the resolution.
Was there a neon release last thursday/friday (14th) because we have been having significant connection pooling and can't reach database server errors since then we no appreciable cause on our side. We are at the point of pulling our hair out 🤣
deep-jade•15mo ago
oh I'm sorry to hear that. Are you on the free tier or on a paid plan?
conscious-sapphireOP•15mo ago
Paid (Launch Plan + 100GB of storage costs)
deep-jade•15mo ago
Have you created a support ticket? If not, you can share your project ID and I'll happily reach out to our engineering team
conscious-sapphireOP•15mo ago
Project Id: raspy-term-40530506
We have thrown the kitchen sink at the problem (pooler, no pooler, connection pool size, pgBouncer=true etc, turned off expensive queries) and we cant figure out whether neon or fly.io or cosmic radiation
If it helps this first started occuring at Jun 14, 2024 at 6:09am BST.
We put Ticket # 3141 in on Sunday night.
conscious-sapphire•15mo ago
I'm looking at your ticket right now 🙂
If it helps this first started occuring at Jun 14, 2024 at 6:09am BST.I reviewed the logs of our proxy in depth on the 14th between 04:45 and 05:15 UTC. During this timeframe, we received 17 connection requests for neondb_owner, all of which were successful. I didn't observe any pooler error or any kind of timeout in those logs. On saturday and Sunday, our proxy captured a few errors caused by unexpected client disconnects, but again, no pooling errors recorded.
conscious-sapphire•15mo ago
Here is a graph showing the number of session established on Friday:

conscious-sapphire•15mo ago
On Saturday:

conscious-sapphire•15mo ago
and on Sunday:

conscious-sapphire•15mo ago
Those are fairly low numbers, far from reaching the maximum capabilities of your endpoint, which was configured with a min_cu of 0.5, so max_connections is set to 225 and by default, pgbouncer default_pool_size is set to 64
you thus had plenty of headroom for additional connections
Regarding pg_stat_statements, I indeed observe an issue.
When the compute endpoint started, we ran a create if not exists statement to enable the extension, but the extension was enabled already:
However, neither pg_stat_statements not pg_stat_activity could be queried:
This is unfortunately everything I have in our logs regarding this specific issue.
And considering that you deleted this endpoint on Sunday, I unfortunately can't connect to it to check if the extension is properly installed 😦
conscious-sapphireOP•15mo ago
Thanks for looking into this.
Ya that was our suspicion as well (based on non of the neon metric graphs showing any real load) but we cant get it to replicate on an RDS alternative. What could cause connection to not be made or there to be pool timeout error but only intermittantly without showing up on the neon dashboard.
The pg_stat_statements issue is resolve but the root issue of the intermittant connections failure is still on going
conscious-sapphire•15mo ago
What could cause connection to not be madeIf a connection is received, but do not result in a successfully established session on the endpoint, this is logged by our proxy (for instance if the proxy can't wake the compute endpoint, or if max_connection is reached, pgbouncer down,...) or in the logs of the endpoint itself (pgbouncer errors, pg down,...). In this specific case, I don't observe any of those.
the intermittant connections failure is still on goingWould it be possible to capture precise timestamps when those connections failure happen, and, ideally, the request_id? I can review our logs for each of the timestamp provided, but it's also possible that your request do not reach us. Having precise timestamps would allow me to verify this point
conscious-sapphireOP•15mo ago
I sent you some from today by private message