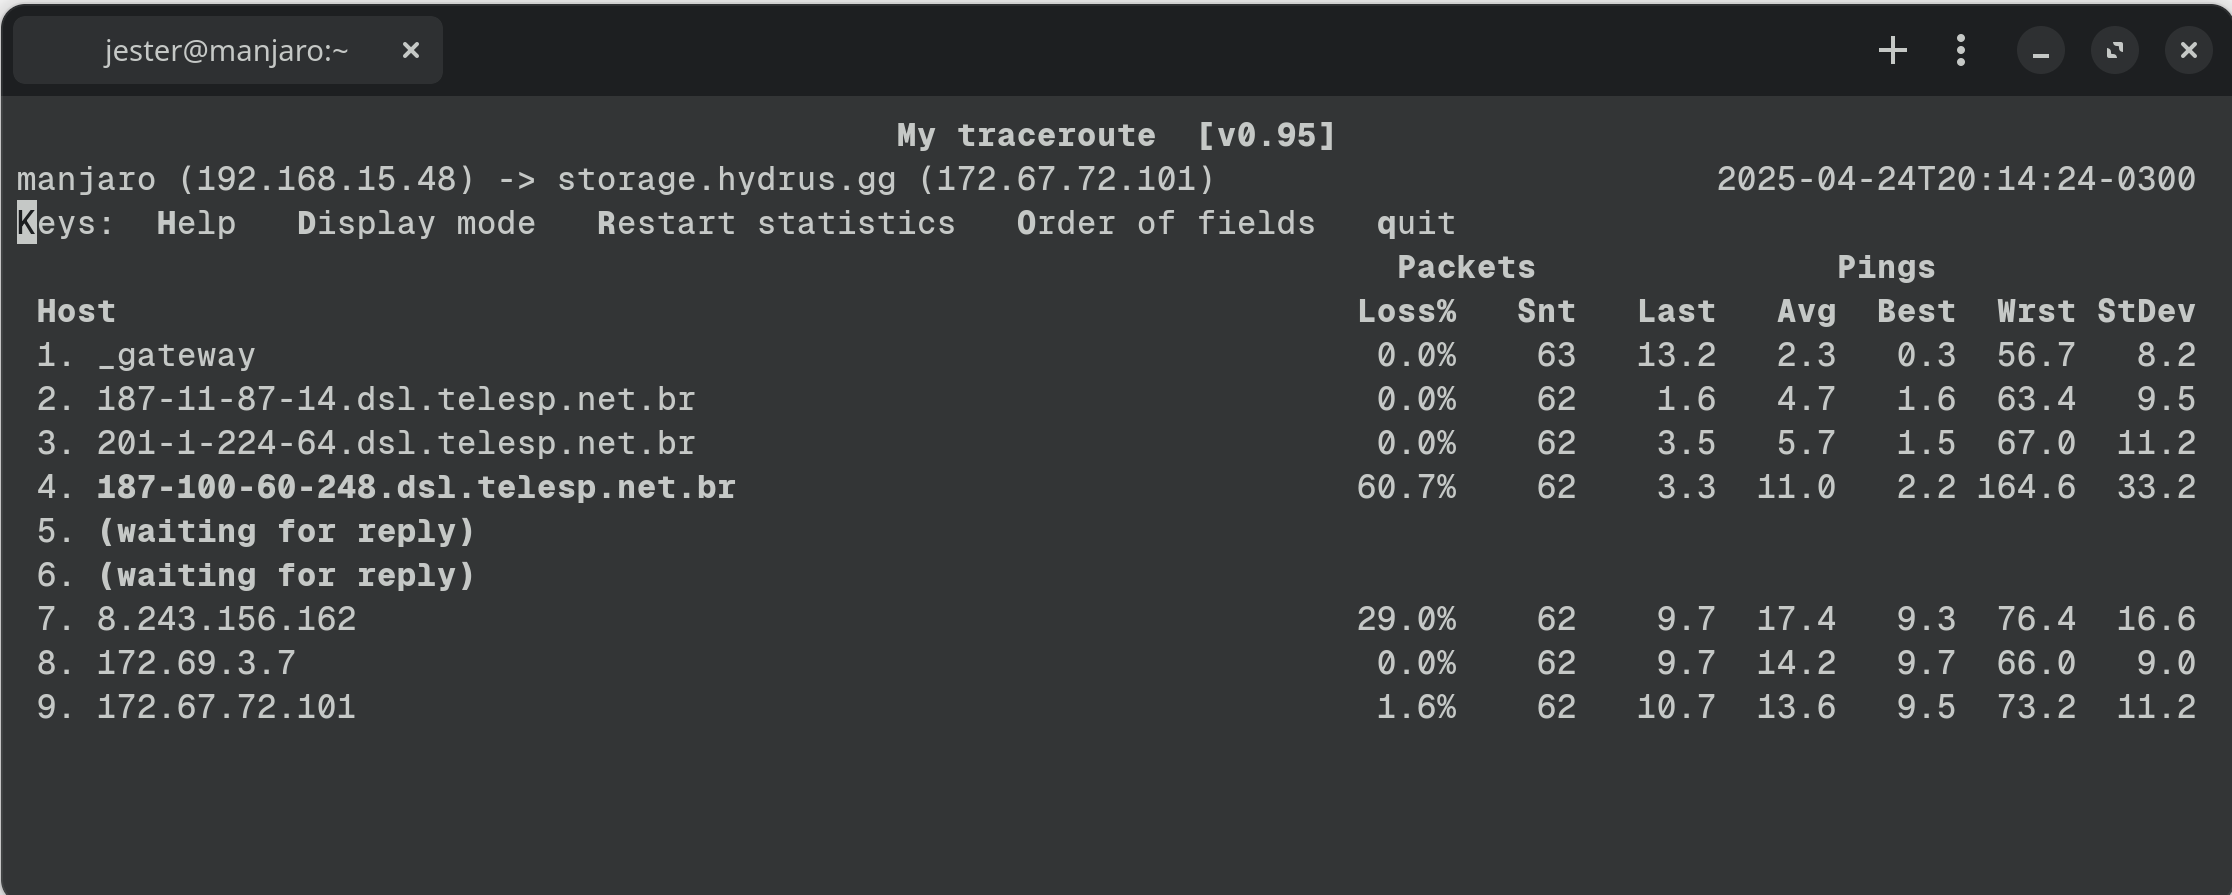
Unstable DNS in Brazil (again)

https://cdn.jesteriruka.dev/vehicles/panto.png ^ R2 Bucket, timeout every single time. When the same URL is requested through OVH (United States), the requested file is downloaded just fine. For some reason, other projects (with Pro plan) don't seem to be affected. 
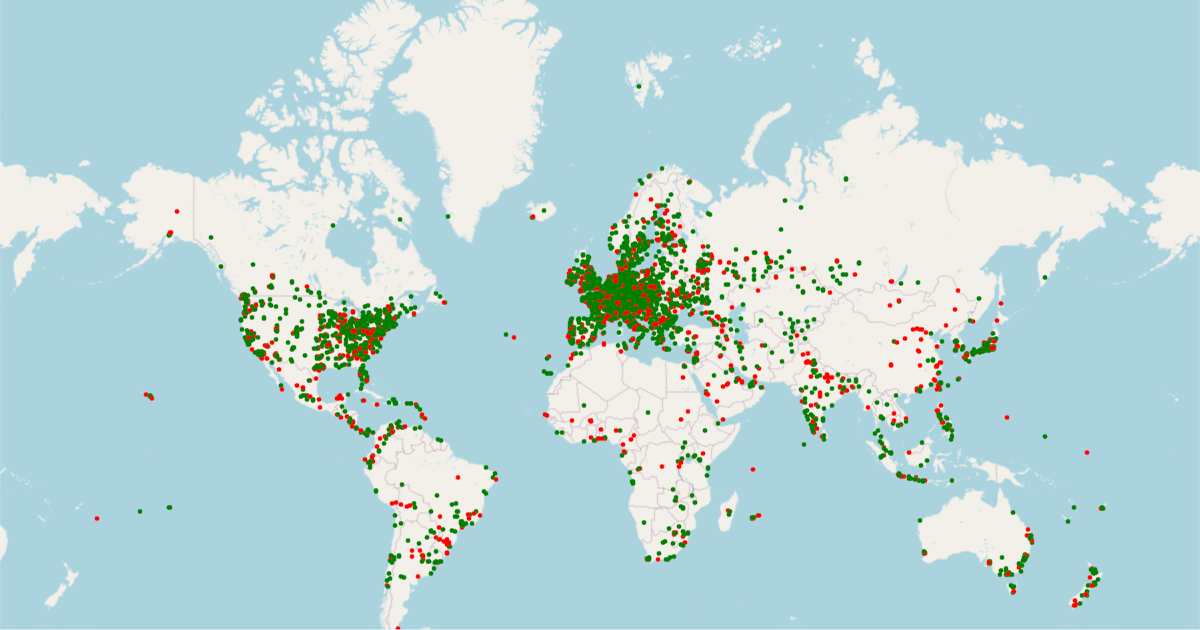
My ISP is Vivo (Telefonica Brasil), a lot of my customers are talking about this, there is also a considerable amount of reports on https://downdetector.com.br/fora-do-ar/cloudflare/
No description
No description
27 Replies
JesterIruka
JesterIrukaOP2w ago
For context: storage.hydrus.gg is also a R2 bucket, but it works. Seems to be solved now, at least for my ISP.
JesterIruka
JesterIrukaOP2w ago
No description
JesterIruka
JesterIrukaOP2w ago
Yes, I also forgot to say this, but jesteriruka.dev has ipv6 disabled. But wasn't only my computer, I provide some sort of SaaS for gta scripting, and a lot of customers had the same connectivity issue with my domain. Maybe that is the reason why other zones didn't had the same issue
Chaika
Chaika2w ago
a good reason to enable IPv6 perhaps, could have been an ISP-wide issue. If it happens again, traceroutes (tracert on windows) are helpful
JesterIruka
JesterIrukaOP2w ago
I did one but didn't sent it.
Tracing route to cdn.jesteriruka.dev [104.21.48.1]
over a maximum of 30 hops:

1 <1 ms <1 ms <1 ms GPT-2741GNAC-N2.GPT-2741GNAC-N2 [192.168.15.1]
2 3 ms 1 ms 6 ms 187-11-87-14.dsl.telesp.net.br [187.11.87.14]
3 3 ms 3 ms 3 ms 201-1-224-64.dsl.telesp.net.br [201.1.224.64]
4 4 ms 4 ms 3 ms 187-100-166-54.dsl.telesp.net.br [187.100.166.54]
5 * * 3 ms 152-255-190-68.user.vivozap.com.br [152.255.190.68]
6 * * * Request timed out.
7 * * * Request timed out.
8 * * * Request timed out.
9 * * * Request timed out.
10 * * * Request timed out.
11 * * * Request timed out.
12 * * * Request timed out.
13 * * * Request timed out.
14 * * * Request timed out.
15 * * * Request timed out.
16 * * * Request timed out.
17 * * * Request timed out.
18 * * 11 ms 104.21.48.1
Unfortunately I'm not sure if I can enable ipv6 without major issues, there is a lot of tokens that are assigned to ipv4, which will break the authentication, maybe is best to just leave this specific area to another A record without cloudflare proxy.
Chaika
Chaika2w ago
hmm, that looks like it was from when it was working since you reached the ip in the end
JesterIruka
JesterIrukaOP2w ago
I did before the successful ping, but probably took long enough to just work.
JesterIruka
JesterIrukaOP6d ago
It's happening again, IPV4 is down.
No description
JesterIruka
JesterIrukaOP6d ago
This is my free website.
No description
JesterIruka
JesterIrukaOP6d ago
This is my PRO website.
No description
JesterIruka
JesterIrukaOP6d ago
Both hostnames are R2 buckets
Peps
Peps6d ago
running a Atlas check to see if that confirms it as well
itsmatteomanf
itsmatteomanf6d ago
oh, was about to do that myself... one is fine i think, so let's wait for yours didn't start mine yet
Peps
Peps6d ago
RIPE Atlas - RIPE Network Coordination Centre
RIPE Atlas is the RIPE NCC's main Internet data measurement system.
RIPE Atlas - RIPE Network Coordination Centre
RIPE Atlas is the RIPE NCC's main Internet data measurement system.
Peps
Peps6d ago
oh wait maybe should've done TLS instead, 1 sec
itsmatteomanf
itsmatteomanf6d ago
everything seems to work...
Peps
Peps6d ago
RIPE Atlas - RIPE Network Coordination Centre
RIPE Atlas is the RIPE NCC's main Internet data measurement system.
Peps
Peps6d ago
looking good so far
JesterIruka
JesterIrukaOP6d ago
V6 is fine.
Peps
Peps6d ago
RIPE Atlas - RIPE Network Coordination Centre
RIPE Atlas is the RIPE NCC's main Internet data measurement system.
JesterIruka
JesterIrukaOP6d ago
I only noticed this issue because customers keep sending me messages.
Peps
Peps6d ago
there's no widespread outage according to those probes, so not sure then looks like a small handful did fail, perhaps a specific ISP acting up
JesterIruka
JesterIrukaOP6d ago
jester@DESKTOP-O11ER2F:~$ ping cdn.jesteriruka.dev
PING cdn.jesteriruka.dev (104.21.80.1) 56(84) bytes of data.
64 bytes from 104.21.80.1 (104.21.80.1): icmp_seq=154 ttl=56 time=9.80 ms
64 bytes from 104.21.80.1 (104.21.80.1): icmp_seq=155 ttl=56 time=10.3 ms
64 bytes from 104.21.80.1 (104.21.80.1): icmp_seq=156 ttl=56 time=9.96 ms
64 bytes from 104.21.80.1 (104.21.80.1): icmp_seq=157 ttl=56 time=8.91 ms
64 bytes from 104.21.80.1 (104.21.80.1): icmp_seq=158 ttl=56 time=10.9 ms
64 bytes from 104.21.80.1 (104.21.80.1): icmp_seq=159 ttl=56 time=10.7 ms
64 bytes from 104.21.80.1 (104.21.80.1): icmp_seq=160 ttl=56 time=10.7 ms
64 bytes from 104.21.80.1 (104.21.80.1): icmp_seq=161 ttl=56 time=9.89 ms
64 bytes from 104.21.80.1 (104.21.80.1): icmp_seq=162 ttl=56 time=10.8 ms
64 bytes from 104.21.80.1 (104.21.80.1): icmp_seq=163 ttl=56 time=55.5 ms
64 bytes from 104.21.80.1 (104.21.80.1): icmp_seq=164 ttl=56 time=10.5 ms
64 bytes from 104.21.80.1 (104.21.80.1): icmp_seq=165 ttl=56 time=8.97 ms
64 bytes from 104.21.80.1 (104.21.80.1): icmp_seq=166 ttl=56 time=10.6 ms
64 bytes from 104.21.80.1 (104.21.80.1): icmp_seq=167 ttl=56 time=9.46 ms
64 bytes from 104.21.80.1 (104.21.80.1): icmp_seq=168 ttl=56 time=9.27 ms
64 bytes from 104.21.80.1 (104.21.80.1): icmp_seq=169 ttl=56 time=8.97 ms
64 bytes from 104.21.80.1 (104.21.80.1): icmp_seq=170 ttl=56 time=10.4 ms
64 bytes from 104.21.80.1 (104.21.80.1): icmp_seq=171 ttl=56 time=8.99 ms
64 bytes from 104.21.80.1 (104.21.80.1): icmp_seq=172 ttl=56 time=8.81 ms
64 bytes from 104.21.80.1 (104.21.80.1): icmp_seq=173 ttl=56 time=10.1 ms
64 bytes from 104.21.80.1 (104.21.80.1): icmp_seq=174 ttl=56 time=10.7 ms
64 bytes from 104.21.80.1 (104.21.80.1): icmp_seq=175 ttl=56 time=8.93 ms
64 bytes from 104.21.80.1 (104.21.80.1): icmp_seq=176 ttl=56 time=10.4 ms
64 bytes from 104.21.80.1 (104.21.80.1): icmp_seq=177 ttl=56 time=9.39 ms
64 bytes from 104.21.80.1 (104.21.80.1): icmp_seq=178 ttl=56 time=9.75 ms
64 bytes from 104.21.80.1 (104.21.80.1): icmp_seq=179 ttl=56 time=9.10 ms
64 bytes from 104.21.80.1 (104.21.80.1): icmp_seq=180 ttl=56 time=19.8 ms
64 bytes from 104.21.80.1 (104.21.80.1): icmp_seq=181 ttl=56 time=9.33 ms
64 bytes from 104.21.80.1 (104.21.80.1): icmp_seq=182 ttl=56 time=10.2 ms
64 bytes from 104.21.80.1 (104.21.80.1): icmp_seq=183 ttl=56 time=8.82 ms
64 bytes from 104.21.80.1 (104.21.80.1): icmp_seq=184 ttl=56 time=10.0 ms
64 bytes from 104.21.80.1 (104.21.80.1): icmp_seq=185 ttl=56 time=14.1 ms
64 bytes from 104.21.80.1 (104.21.80.1): icmp_seq=186 ttl=56 time=10.3 ms
64 bytes from 104.21.80.1 (104.21.80.1): icmp_seq=187 ttl=56 time=9.00 ms
64 bytes from 104.21.80.1 (104.21.80.1): icmp_seq=188 ttl=56 time=11.5 ms
64 bytes from 104.21.80.1 (104.21.80.1): icmp_seq=189 ttl=56 time=11.1 ms
64 bytes from 104.21.80.1 (104.21.80.1): icmp_seq=190 ttl=56 time=9.85 ms
64 bytes from 104.21.80.1 (104.21.80.1): icmp_seq=191 ttl=56 time=9.18 ms
64 bytes from 104.21.80.1 (104.21.80.1): icmp_seq=192 ttl=56 time=10.4 ms
64 bytes from 104.21.80.1 (104.21.80.1): icmp_seq=193 ttl=56 time=9.60 ms
64 bytes from 104.21.80.1 (104.21.80.1): icmp_seq=194 ttl=56 time=9.14 ms
64 bytes from 104.21.80.1 (104.21.80.1): icmp_seq=195 ttl=56 time=9.24 ms
64 bytes from 104.21.80.1 (104.21.80.1): icmp_seq=196 ttl=56 time=11.1 ms
64 bytes from 104.21.80.1 (104.21.80.1): icmp_seq=197 ttl=56 time=10.1 ms
64 bytes from 104.21.80.1 (104.21.80.1): icmp_seq=198 ttl=56 time=50.6 ms
64 bytes from 104.21.80.1 (104.21.80.1): icmp_seq=199 ttl=56 time=10.2 ms
^C
--- cdn.jesteriruka.dev ping statistics ---
199 packets transmitted, 46 received, 76.8844% packet loss, time 204177ms
rtt min/avg/max/mdev = 8.810/12.072/55.542/8.919 ms
Seems to be normal again. Is there a separation between Free/Pro plan? I don't get it why only the free website was down.
Peps
Peps6d ago
different ip ranges are used between plans yeah
JesterIruka
JesterIrukaOP6d ago
Perhaps I should upgrade this one, a lot of problems recently.
MattIPv4
MattIPv46d ago
If it goes down again, a traceroute might be more useful to run to see where the traffic is being dropped. If you can gather a bunch of traceroutes showing a repeated issue, fire them off to whoever it points to (I suspect the ISP)
JesterIruka
JesterIrukaOP6d ago
Tracing route to cdn.jesteriruka.dev [104.21.96.1]
over a maximum of 30 hops:

1 <1 ms <1 ms <1 ms GPT-2741GNAC-N2.GPT-2741GNAC-N2 [192.168.15.1]
2 2 ms 1 ms 1 ms 187-11-87-14.dsl.telesp.net.br [187.11.87.14]
3 3 ms 1 ms 1 ms 201-1-224-70.dsl.telesp.net.br [201.1.224.70]
4 2 ms 1 ms 2 ms 187-100-183-8.dsl.telesp.net.br [187.100.183.8]
5 7 ms 8 ms 8 ms 152-255-212-240.user.vivozap.com.br [152.255.212.240]
6 7 ms 8 ms 8 ms 152-255-176-58.user.vivozap.com.br [152.255.176.58]
7 12 ms 13 ms 13 ms 187-100-168-129.dsl.telesp.net.br [187.100.168.129]
8 * * * Request timed out.
9 * * * Request timed out.
10 * * * Request timed out.
11 * * * Request timed out.
My traceroute [v0.95]
DESKTOP-O11ER2F (192.168.30.90) -> cdn.jesteriruka.dev (104.21.48.1) 2025-04-24T21:16:54-0300
Keys: Help Display mode Restart statistics Order of fields quit
Packets Pings
Host Loss% Snt Last Avg Best Wrst StDev
1. 192.168.16.1 0.0% 59 0.2 0.3 0.2 0.8 0.1
2. 192.168.15.1 0.0% 59 0.6 2.4 0.4 40.5 7.3
3. 187-11-87-14.dsl.telesp.net.br 0.0% 59 2.5 7.3 1.7 56.9 12.6
4. 201-1-224-70.dsl.telesp.net.br 0.0% 59 3.5 6.5 1.6 58.7 12.5
5. (waiting for reply)
6. (waiting for reply)
7. (waiting for reply)
8. 8.243.156.162 24.1% 58 9.3 13.1 8.8 37.7 5.8
9. 172.69.3.7 0.0% 58 10.5 14.0 8.5 53.8 9.5
10. 104.21.48.1 0.0% 58 10.3 12.5 8.6 65.5 12.0
Note that the ips are different. I'm already trying to upgrade my plan/creating a subdomain in a Pro zone to solve the issue.

Did you find this page helpful?