Help needed with a possible memory leak on my server.
I’m dealing with a memory leak issue on my server that I just can’t seem to fix. The memory usage keeps climbing steadily and never goes back down, eventually causing the server to crash. I’ve checked a few things, but nothing seems to help.
Here’s my server setup:
RAM: 6GB
CPU: Ryzen 7 7700
Mods:
c2me
carpet-extra
carpet-tis-addition
catbans
Chunky
Discord-MC-Chat
fabric-api
fabric-carpet
fabric-language-kotlin
ferritecore
journeymap
ledger
lithium
LuckPerms
modernfix
NoChatReports
plasmovoice
servercore
servux
spark
syncmatica
I’ve been keeping an eye on the memory usage, and it just keeps increasing and never drops back down, which eventually causes the server to crash. I’m at a loss for how to fix this. Does anyone have any suggestions, or have you dealt with a similar issue before?
Any help would be greatly appreciated!
45 Replies
a spark report would probably assist
!spark
Spark Profiler
Spark can be used to see why your server or client is lagging.
Users can share a spark report via
/spark profiler start --timeout 300 which creates a report after 5 minutes. The spark report is useful in debugging why your server is lagging, so ideally you should always provide one while asking for support.
Download | Website | Docs
Admincraft Canned Responses
For some reason this command doesn’t work properly
!logs
Please check your server log for errors from your plugins.
If you need further help understanding the errors, please send us the whole log file.
Where can I find the server log?
Logs are stored in
<server_directory>/logs/. Search for a file explorer in your server's management interface and navigate to that directory. Once you've opened that up, search for the latest.log file. Some providers have a separate page for logs and may hide the "logs" folder.
On Aternos:
• Go to https://aternos.org/log/.
On Minehut and server.pro:
• Go to the "files" tab in the left menu.
• Navigate to the root directory of your server.
• From there navigate to /logs/latest.log.
What should I do with the log?
• First of all, read it! I mean, that's what you do all the time when you run a server, isn't it? Try to locate any errors that have anything to do with the issue you are facing.
• If you got the latest.log file or created a .txt file with the necessary errors you can upload these directly to the channel, but we prefer if you upload them to https://mclo.gs/.
• If you have trouble downloading the log file, copy/paste the text to a paste service (like mclogs). Copy the link that it gives you and send it to us. (Don't worry, McLogs hides your users' IPs.)Admincraft Canned Responses
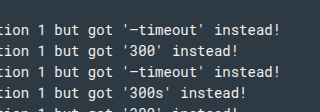
What's the output of running spark that doesn't work?
[18:47:17] [spark-worker-pool-1-thread-2/INFO]: [⚡] Expected flag at position 1 but got '—timeout' instead!
spark profiler —timeout 300
[18:47:33] [spark-worker-pool-1-thread-3/INFO]: [⚡] Expected flag at position 1 but got '300' instead!
spark profiler start —timeout 300
tried the exact same command and it just worked
weird, but ill update u in 5 minutes with the spark link
spark profiler start --alloc
Send the logs in something like mclogs, I'm not sure if that '—timeout' instead! is discord or minecraft combining the '--' into '—'you want me to grab the latest.log and put it into mclogs?
yup
heres the spark link too https://spark.lucko.me/Avt5sqipnL
spark
spark is a performance profiler for Minecraft clients, servers, and proxies.
You're combining '--' into '—'' somehow
no clue
i was typing it on my phone
so maybe its just an iOS thing
It is
but when i typed it through the panel on my pc
it worked
Copy the --timeout flag instead of typing it
yea
will do next time if i need to use my phone
So do you have any possible idea as to why the memory just increases and never decreases?
Everything seems fine here, I'd just add aikar's flags
Run
spark profiler start --alloc when you notice the memory leak, then run spark profiler stop after a couple of mins (3-5)Okay will do
Also do you have any idea why when I contacted support for this on the official hosters discord they told me my server had no mods and was running vanilla minecraft?
Is that a me problem or a them problem?
Because even spark shows its on fabric
You can also run
spark heapdump to get a snapshot of the heap and analyze it with something like intellij or eclipse memory analyzerhttps://spark.lucko.me/EfFOQiQtNP heres the --alloc link
spark
spark is a performance profiler for Minecraft clients, servers, and proxies.
no idea, its clearly running fabric with a lot of mods
yeah idk what theyre on about then
it doesnt have a lot of mods, theres probably about 9 or 10
Yh, i don't have a good definition of what's a lot, I usually keep plugins at minimum possible, and I don't run modded servers
Yeah only reason we use mods is because we use fabric, because we want as close to vanilla as possible
Looks like normal stuff from carpet and c2me
Doesn't look like a memory leak
It's just like, the ram doesnt come back down
It plateaus for a while then it just goes up, and then plateaus again
Try running it when the ram is higher
and take a heapdump
Will do
You'll have to analyze that yourself tho, heapdumps take a couple of gb
Do you have any advice for possibly increasing server performance?
yeah this heapdump was 1gb
Aikar's flags | PaperMC Docs
Aikar's flags are a set of JVM flags designed to improve the performance of your Paper server.
Seem to work well on fabric as well
Tho your ptero ram indicator will become unreliable

My panel doesn't allow me to change the startup command
No idea, fabric is out of my scope, but I don't think it has optimization alternatives besides installing lithium
ill make my mods folder more minimal
might reload most if not all of them
Seems to be a little better now, If the support for humbleservers ever reply ill ask them to change the startup command for me
how are you checking the memory usage for your server?
With spark, or just checking what the panel shows?
both with spark and panel
sorry for quick reply
well, the memory usage you see in spark shouldn't only increase
it should jump up and down
it just jumps up and up and up
well, every ~30 seconds it should go down, according to the spark reports
ive decided to switch hosters now tho, so hopefully all should be smooth sailing
nop, just up and up
anyways, it's normal for java to just not release memory
the launch arguments say it can use up to 3gb of memory, so it'll use up to 3gb of memory and run garbage collection only when it needs to
unless you have GC running excessively frequently (every 5s or more frequently) or your server crashes with an
OutOfMemoryException, you probably don't have a memory leak.