Assets serving tail latency
I ship static assets with my worker, in run_worker_first=false mode with custom _headers. This is a low volume worker (hundreds of requests per day).
I'm seeing massive tail latency, TTFB of over a second (vs 40ms on a warmed up worker in my closest colo). Is this normal & to be expected?
31 Replies
Is your custom header static or does it do any calculations? Have you checked out the logs?
Does it happen on all endpoints or just some?
Does it happen just on static assets or also on the worker endpoints?
it's a static _headers file, no calculations. Happens on Worker endpoints too, IIRC, but there I'm more forgiving since it needs to cold boot. I was expecting assets to not have the same cold boot path though
I have Datadog Real User Monitoring and P99 measured on users' browsers look like this
/ is the index.html path, /client-api/v1/whoami is a super simple response served by the Worker with no subrequests or I/O. Everything else is a static asset shipped with the worker.
My _headers is just:
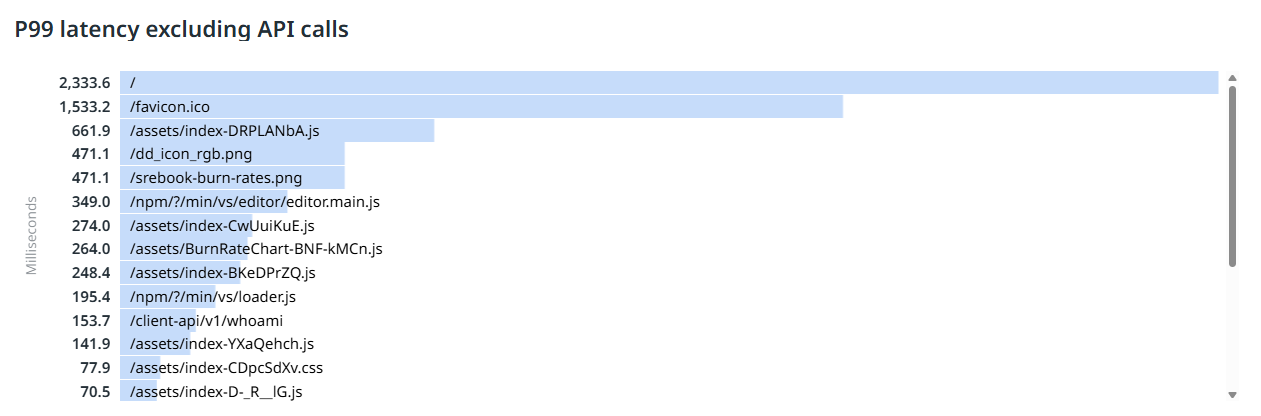
So it looks like the worker cold booting in the /whoami endpoint has a pretty good p99 latency, it's my big assets (that JS file is ~400KB gzipped) and even more so my index.html and other root-level assets that are not covered by
_headers which are the worst
Those static assets not covered by _headers default to Cache-Control: public, max-age=0, must-revalidate, which is definitely what I want for index.html and therefore the very first request a browser makes (for a 0.6KB index.html) takes over two seconds P99Hm, that's odd.
Can you show us your wrangler config?
Not much to it
oops, I think I found an issue with my deployment process... I'm suspecting the
_headers file was not bundled properly. Still, I want the index.html with max-age=0,must-revalidate so that part of the ask is still validAnd you are sure that the lion share of this latency is the cf worker wall time?
no, assets requests don't even show up in worker logs with run_worker_first=false
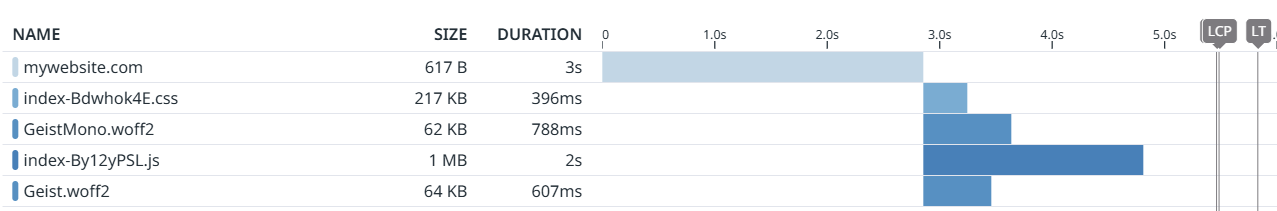
And if you trace your page in the browser, what does the waterfall say?
this is captured by Datadog RUM with the navigation API in the browsers. That P99 was also user-centric, capturing the full path
This same waterfall I posted has a 52ms request to the /whoami worker endpoint, so this is strictly a cold-boot asset load issue, not even a worker cold boot issue
The only other thing I haven't mentioned is I have CF Access running on this domain but I think it can be ruled out if it's not slowing down the worker endpoints
LCP at second 6 💀
I mean that's interesting but I meant something like this:
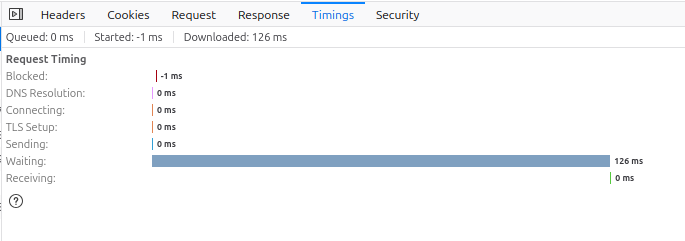
exactly
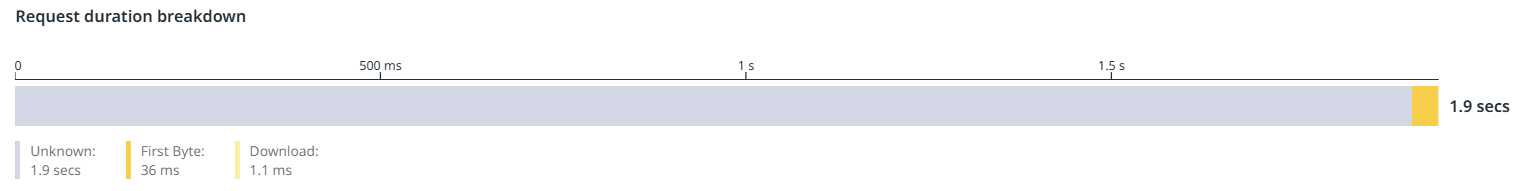
I don't think it gets this granular. Will check later at my computer
If you want, you can send me your domain and I'll take a look myself.
it's behind CF Access like I said
company internal stuff
Ah I see
I would note a few things:
Assets in Workers and Assets in Pages are in KV, KV has two central stores: EU, US. If you get tons of traffic, your site is going to be cached at edge everywhere. If you get very little traffic, you're likely to be pulling from one of the central stores, most painfully if the request is from Asia Pacific
Your DataDog test is probably not sending Sec-Fetch-Mode Navigation unless it's a full browser, so it's probably hitting your Worker which then returns the html, which would add some latency
these are real users being monitored through RUM, I'm not talking about datadog synthetic tests here which can report uptime and latency
it's interesting that you say it's stored in KV. my worker caches api responses in KV and I don't see this latency cliff for kv cache hits. It's couple hundred ms for a cold worker and cold KV, but certainly not over a second from what I've seen
yea, I wouldn't expect more then a couple hundred ms for a cold hit even
are my observations atypical then? Should I reach out to my account manager and get support that way?
I think 2s for a workers static asset is pretty crazy yea. They might ask for more info/some reproducibility though, RUM doesn't tell the full story
There are a lot of other variables, if it's real users:
Free plan in India often gets routed to Europe by Indian ISPs, and German ISP DTAG -> East Coast (sometimes.. it's been a bit since I've heard about it), as well as generally some iffy routing in the Asia Pacific region.. but I would only expect a few hundred milliseconds about it
If the main page html is big it could just be download latency but I'd imagine it'd have to be pretty big for that to start happening
Do you know what your sample size is/how frequently it is accessed, relatively? If it's super popular I def wouldn't expect any of that at all, if it's just an internal site infrequently used.. it makes some more sense
I've never seen 2+ second response times on CF, I'd not be surprised if it's a different part of the network that's the bottleneck. Hence a waterfall would be helpful imo.
my users are all in the UK and Europe. The other thing is they could be going over the company VPN but that's still Cloudflare WARP
OK I could just be misreading my tools, or the tools themselves just suck
This isn't the request queueing that the browser does because it's an index.html fetch, but I still can't explain the measurement
maybe their local dns resolver or something? Hard when it's client data
OK false alarm, it's the Cloudflare Access redirect after authenticating for the first time that's being counted towards my load time on index.html
I think it's a limitation of the navigation timing APIs and not delineating redirect chains
ahh that's interesting, I would think it'd be a quick response for the redirect -> separate web page -> back to normal web page
same request for my own session

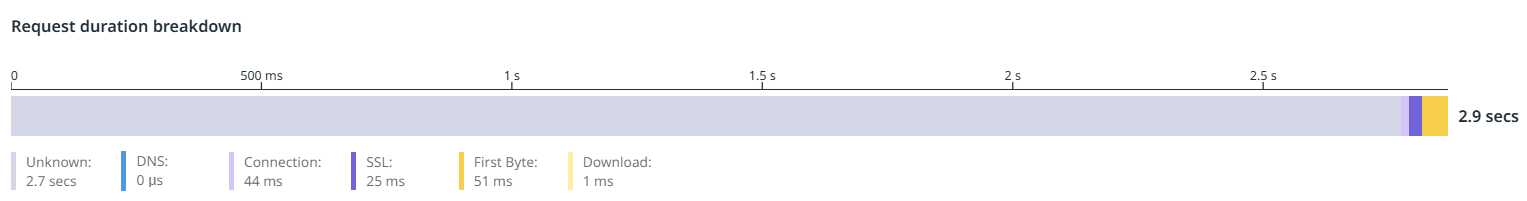
It's measuring the whole 302 redirect chain, which makes sense I guess but is irrelevant when it comes to optimizing my app, since I can't optimize CF Access 😄
Thanks for the help, in the end it was the thing I suspected the least