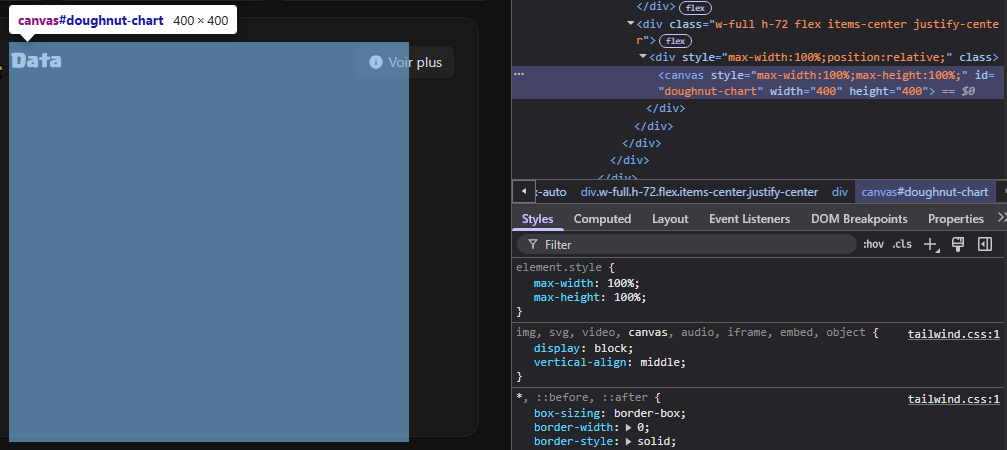
ChartJS not showing
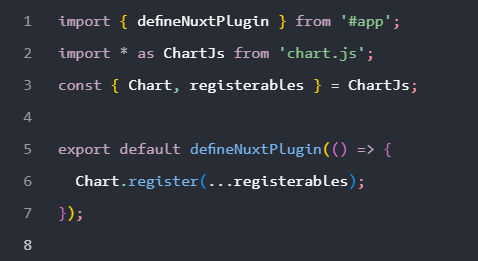
Hi! I recently tried to add a chart with the help of chart.js, I reused the code from the vue-chart-3 documentation (https://vue-chart-3.netlify.app/guide/examples/vue3.html which brought me to https://codesandbox.io/p/sandbox/demo-vue-chart-3-ugynm?from-embed) but unfortunately nothing is displayed on my page, I tried many other things, including adding a plugins/chartjs.client.ts file, but nothing changes, it still does not display.


3 Replies
Hi @Aldebaran. I'm kapa.ai, your friendly support bot. I will try to answer your question by searching through the knowledge base. :wave:
----------------------
I'm sorry you're having trouble displaying a Chart.js chart in your Nuxt app. Based on the knowledge sources, here are some key points and troubleshooting steps:
1. Component Setup: Make sure your chart component is correctly set up. For example, using
vue-chartjs
with Nuxt 3, your component might look like this:
This setup is confirmed to work in Nuxt 3 when the correct data and options are passed in as props from the parent component. Make sure your chartData
and chartOptions
are properly structured and reactive. See the example in this source for more details.
2. Data Structure: The most common issue is with the structure of the chartData
object. It must include a datasets
array. For example:
If you omit datasets
, Chart.js will not render and may throw a type error. See this source for a detailed example.
3. Client-only Rendering: If you are using a plugin or a component that depends on the browser (like Chart.js), make sure it only runs on the client side. You can wrap your chart component in <client-only>
to ensure it doesn't try to render on the server:
This is a common pattern for browser-only libraries in Nuxt 3.
4. Plugin File: If you created a plugins/chartjs.client.ts
file, ensure it is correctly set up and that you are not missing any required imports or registrations. However, for most vue-chartjs
use cases, you do not need a plugin file—just import and register Chart.js components as shown above.
5. Debugging: If nothing is displayed and there are no errors, check your browser console for warnings or errors. Also, inspect the DOM to see if the <canvas>
element is present and has a size. Chart.js requires the canvas to have a width and height.
If you follow these steps and your chart still does not display, please double-check your data structure and ensure you are using the correct versions of vue-chartjs
and chart.js
compatible with Vue 3 and Nuxt 3.
If you have a specific error message or code snippet, please share it for more targeted help.
References: How to pass data for chart in chart.js without getting a type error
----------------------
Note: you can ask me a follow up question by @ mentioning me again :speech_balloon:
----------------------<@635025274538295336> Kapa.ai is still learning and improving, please let me know how I did by reacting below.
I reviewed the points mentioned by the AI above but I don't see anything wrong.