Compute times optimizations
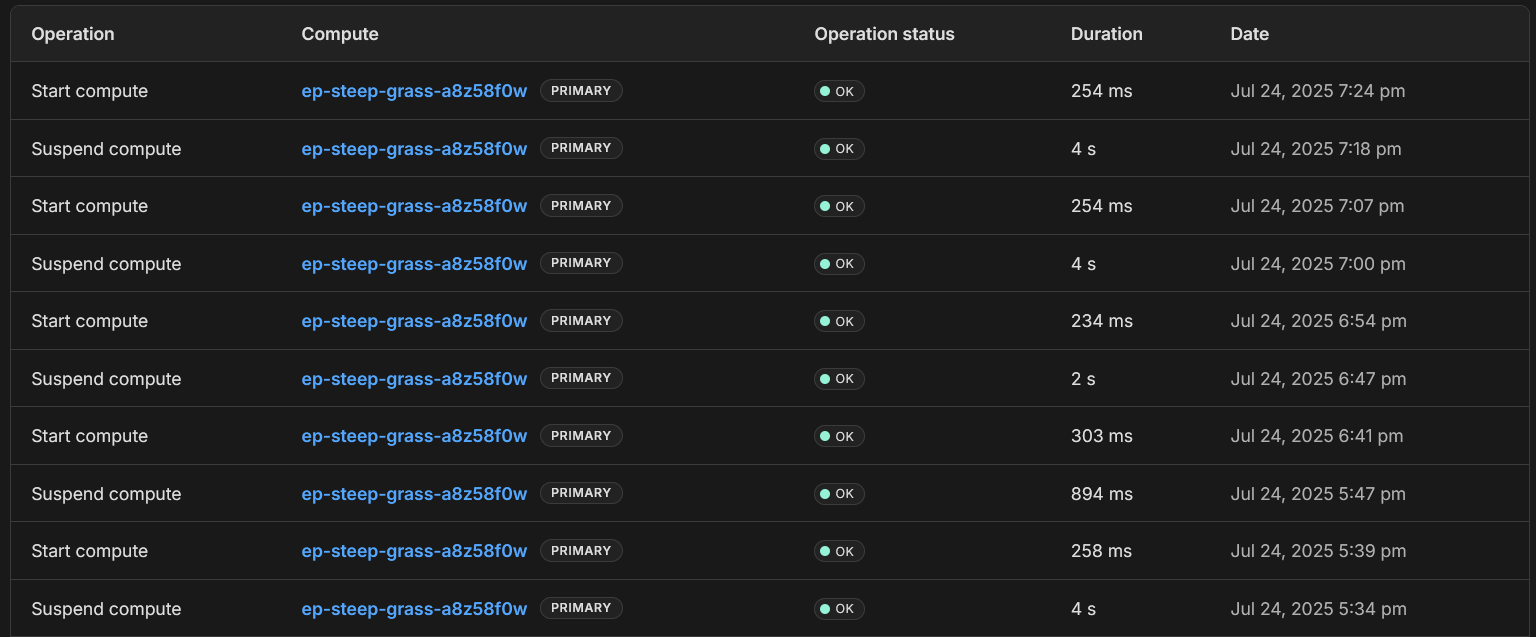
So I own a serverless map website and it does a lot of connecting to the database and dropping the connections basically for each time a user loads a part of the map. Due to this my compute time goes up a crazy amount it seems. more than it does on any other service i use. Is there anyway to optimize this? a lot of the
Suspend compute
Operations take a few seconds and i'm not sure why.
11 Replies
afraid-scarlet•2mo ago
Hey, a good starting point is always to review all your currently active branches and their compute settings. Make sure the
min
is not too high to avoid over-provisioning. You can also review the CPU graph in the branch monitoring tab.
On the free tier, if your min
is 0.25 CPU and 0.25 CPU is never exceeded, you can have your database running 24/7 without hitting the limits. I would be surprised if supsend operations would play a role here.genetic-orangeOP•2mo ago
Is there anywhere to see clearly a compute time graph to see what is taking up a decent amount of compute time in my project?
my database doesnt even go over .05 of used CPU (it peaked at .07 within the last day). So I honestly dont get why changing the min compute (even though its on its lowest setting) really effects my compute times.
genetic-orangeOP•2mo ago
it really seems to me that suspended operations are what is taking up all of my compute time. this really adds up at the end of the day and month to where my compute time runs out of the month and my database goes down.

afraid-scarlet•2mo ago
Check the CPU graph in the monitoring tab. There are two lines: allocated and used CPU. If your database is running, it always has at least the
min
CPU allocated. It starts with 0.25, scales to 0.5 and so on. Even if you only use 0.05
compute, if your min is at 2 CPU
, we'll allocate 2 CPUs and you will use much more compute than needed.genetic-orangeOP•2mo ago

genetic-orangeOP•2mo ago
my min and max is at .25 because i never need anymore than that.
genetic-orangeOP•2mo ago
this is the past day stats

afraid-scarlet•2mo ago
And you're seeing more compute used than this?
Can you make sure no other branches are active? Each active branch counts towards the limits.
genetic-orangeOP•2mo ago
i believe i was just misreading the graphs i think i understand why now
i only have 1 branch
genetic-orangeOP•2mo ago
i see for example this is like a few minutes used right here of compute time

genetic-orangeOP•2mo ago
its pretty surprising to me i guess
i still dont understand how changing the scaling settings will help with my compute usage times