10 Replies
how am i supposed to plot it
@Apu
Note for OP
+solved @user1 @user2... to close the thread when your doubt is solved. Mention the users who helped you solve the doubt. This will be added to their stats.Lemniscate
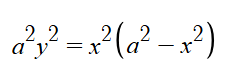
In algebraic geometry, a lemniscate ( or ) is any of several figure-eight or ∞-shaped curves. The word comes from the Latin lēmniscātus, meaning "decorated with ribbons", from the Greek λημνίσκος (lēmnískos), meaning "ribbon", or which alternatively may refer to the wool from which the ribbons were made.
Curves that have been call...
plotting usually gives a good idea but ig you are right
only thing i infer is the symmetricity , without the graph the image is hazy
also cant figure out the fact total algebraic area is zero
+ve and -ve x and y mein symmetry matlab saare quadrants mein symmetric. Consider x=asin(theta), then y-a^2.sin^2(2theta)/4
theta=pi/2 and 0 pe y=0 and you can see, as theta increases from 0 to pi/2, sin^2(2theta) increases initially, reaches a maximum at x=pi/4 and then decreases to zero.
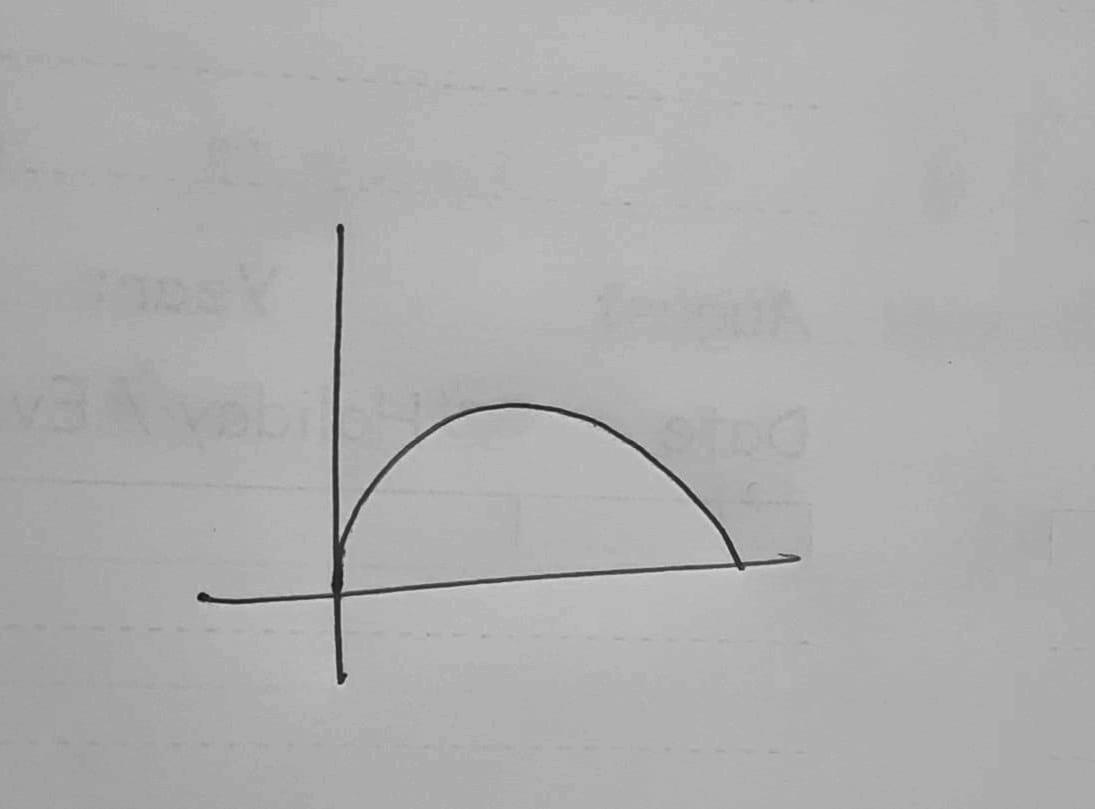
Giving you a shape like
Well, the upper right quarter of the figure above
So you can use symmetry to get the who;e thing
As for this, just think of it this way, assume this is thermodynamics ka P-V graph and ask yourself, what would be the work done (put arrows from origin to clockwise coming back to origin and then going to the left loop counterclockwise) in the whole process. It will just be zero.
:wah: Net finally back
damn.
+solved @SirLancelotDuLac
Post locked and archived successfully!
Archived by
<@741159941934415883> (741159941934415883)
Time
<t:1755243283:R>
Solved by
<@1075951732460376214> (1075951732460376214)