select 1 queries in production

Hey all, I'm trying to track down an inconsistency between dev and prod environments - 
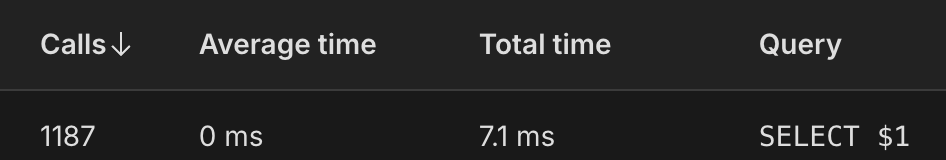
I'm using Neon postgres, and I'm finding that in my production environment, Prisma is running a SELECT 1 query about every 5 seconds, but it doesn't seem to happen at all in development. I haven't been able to find any options about enabling/disabling this behavior, and I'm having trouble even figuring out what's triggering it it one environment and not the other. This looks like some kind of connection health check, but it's causing the connection from my application to Neon to never go fully idle, which means I'm winding up paying for uptime usage when it should be spinning down to zero when inactive. I've verified it's coming from the PrismaPg adapter by patching the pool query to trace the source, but that hasn't gotten me very far. In prod, it's showing the pool acquire/release every 5 seconds, with the trace coming from @prisma/client/runtime/library.js:6:6846 showing the SELECT 1 query.
const pool = new Pool({
connectionString: config.db.pooledConnectionUrl,
idleTimeoutMillis: 10000,
maxLifetimeSeconds: 60,
application_name: 'rent-chores-api-prisma',
});
pool.on('acquire', () => console.log('acquire'));
pool.on('release', () => console.log('release'));
pool.on('error', (err) => console.error('Error:', err));
pool.on('remove', () => console.log('remove'));
pool.on('connect', () => console.log('connect'));

const oldQuery = pool.query;
pool.query = ((...args) => {
console.log('query', args);
console.trace();
return oldQuery.apply(pool, args as any);
}) as any;

const adapter = new PrismaPg(pool);
No description
6 Replies
Prisma AI Help
You selected the carefully hand-crafted route. A dev artisan will respond soon. Meanwhile, the #ask-ai channel awaits if you're curious!
nickallencse
nickallencseOP7d ago
Logs that repeat every 5 seconds in production, but never occur in development:
acquire
release
query [
{
text: 'SELECT 1',
values: [],
rowMode: 'array',
types: { getTypeParser: [Function: getTypeParser] }
},
[]
]
Trace
at PrismaService.pool.query (/usr/src/app/dist/apps/<app>/main.js:1213:21)
at PrismaPgAdapter.performIO (/usr/src/app/node_modules/@prisma/adapter-pg/dist/index.js:607:40)
at PrismaPgAdapter.queryRaw (/usr/src/app/node_modules/@prisma/adapter-pg/dist/index.js:569:41)
at /usr/src/app/node_modules/@prisma/client/runtime/library.js:6:6846
This is with Prisma 6.14.0, but I was having similar issues with 6.8.0 prior to upgrading to try and pass the pool instance directly to help troubleshoot.
nickallencse
nickallencseOP7d ago
I've found this - https://github.com/prisma/prisma/discussions/5604, which suggests it's related to connection health testing, but it's from several years ago, and I'm not finding much else recently suggesting this is still done. Also tried searching the prisma repo for this query, but didn't come across anything.
GitHub
Why does Prisma run the query 'SELECT 1' in some queries? · prisma...
I&#39;ve noticed Prisma runs SELECT 1 sometimes and sometimes it doesn&#39;t, it would be nice to know what &quot;triggers&quot; this to be ran and what it does, isn&#39;t a SELECT 1 query by itsel...
nickallencse
nickallencseOP7d ago
I'm assuming this is something I won't be able to modify without potentially affecting the connection stability, but I'd at least like to understand what's causing the difference between development and production environments.
Nurul
Nurul6d ago
I haven't seen other Neon users run into this issue. I am assuming that you have the exact same setup in Dev environment as you have in Prod. It would be interesting to see if you get the same SELECT 1 queries if you don't use driverAdapaters to connect.
nickallencse
nickallencseOP5d ago
Bizarre, I swapped out the adapter for the default setup, and I'm still seeing the same behavior difference between dev and prod. I even pulled all environment configs to my local instance to make sure I was connecting to the same database the same way, and built the same Docker image that's being used in production on render.com. Running it locally with exactly the same production environment configs still never caused a SELECT 1 to trigger, and it's still happening every 5 seconds in production after swapping back to the default prisma-client-js client without the adapter.
client.$on('query', (e: QueryEvent) => {
this.logger.debug('Query: ' + e.query + '\nParams: ' + e.params, e);
console.trace();
});
client.$on('query', (e: QueryEvent) => {
this.logger.debug('Query: ' + e.query + '\nParams: ' + e.params, e);
console.trace();
});
debug: ┏ Query: SELECT 1
Params: []
debug: ┃ [1] {
debug: ┃ [2] context: {
debug: ┃ [3] timestamp: 2025-08-25T21:52:31.877Z,
debug: ┃ [4] query: 'SELECT 1',
debug: ┃ [5] params: '[]',
debug: ┃ [6] duration: 2,
debug: ┃ [7] target: 'quaint::connector::metrics'
debug: ┃ [8] }
debug: ┗ [9] }
Trace
at EventEmitter.<anonymous> (/usr/src/app/dist/apps/rent-chores-api/main.js:1262:21)
at EventEmitter.emit (node:events:524:28)
at Gr.logger (/usr/src/app/node_modules/@prisma/client/runtime/library.js:112:1337)
at /usr/src/app/node_modules/@prisma/client/runtime/library.js:112:1075
Closing this out in case someone searches for something similar later - It wound up being an issue with the API health checks. The Render service monitor was hitting my /healthz endpoint every 5 seconds, which I wasn't logging, and was submitting the SELECT 1 through prisma to verify the connection to the database was still healthy, but was causing it to never drop below at least 1 connection in the database pool.

Did you find this page helpful?