Creating charted data values in a UI
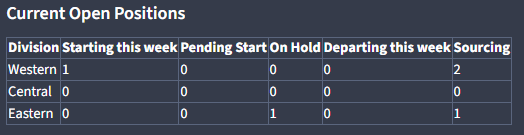
Good morning, Twenty-mates. I have a table of numerical values in Twenty. I have several views created from this table. I need to create a very basic chart of those values in a UI. I would really appreciate a little help on this. This is what the table will need to look like.