🦆 I think I'm answering my own question here, but thought I'd share my rubber-ducking journey… 🦆
 I think I'm answering my own question here, but thought I'd share my rubber-ducking journey…
 How can I understand the
rows_written_24h value from wrangler d1 info?I've got a worker, which inserts a single row every 5 minutes, so basically 288 times per day. But I have these stats:
The database has a single table with 8 columns: 3 added in the initial create table migration, and 5 added via another migration. But as mentioned, I only write one row at a time, and have no other inserts/updates/deletes. There are no indices on the table.
The table only has ~1830 rows so far, so I don't know how I could have 8565 writes today alone.
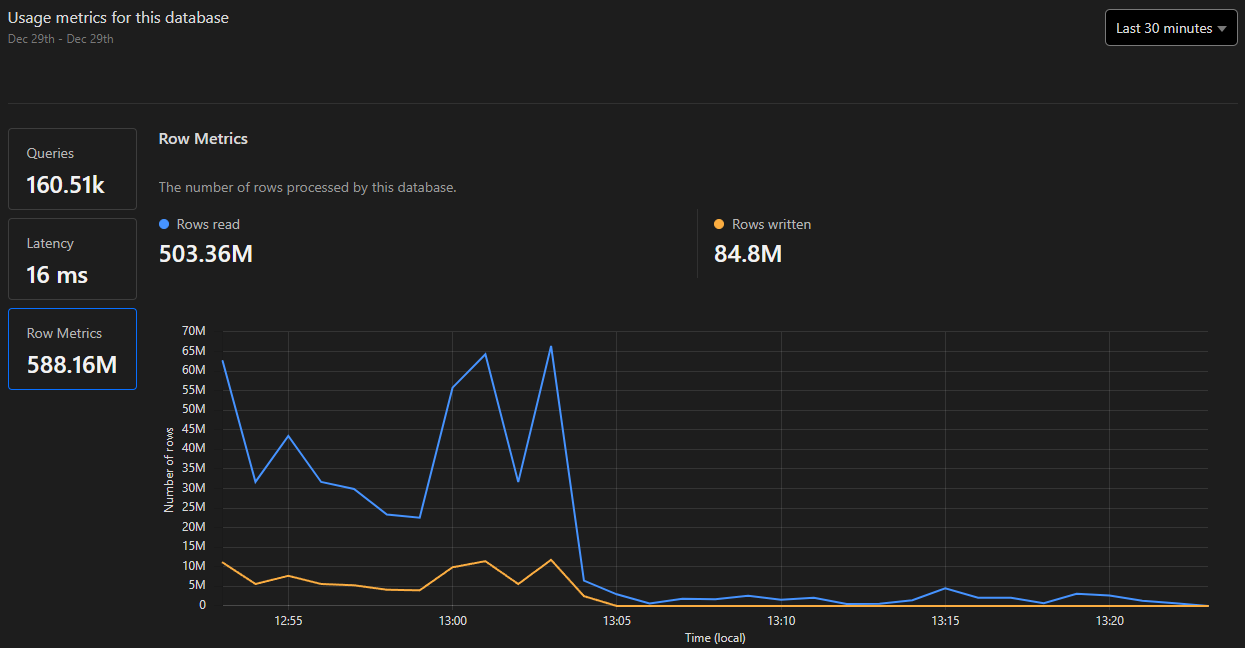
 However, looking at the dashboard metrics graph, spikes in rows written appear to correlate with spikes in rows read…
My one query is basically
SELECT * FROM x ORDER BY timestamp DESC LIMIT y — is there some sort of temporary table being created behind the scenes that gets written to?Looking at the
EXPLAIN for this query, I see OpenEphemeral being called which creates a transient table. Or more simply by using EXPLAIN QUERY PLAN, it shows USE TEMP B-TREE FOR ORDER BY.So I guess we're billed for writes to ephemeral in-memory tables created during the execution of a query?

Anyway, predictably, adding an index on
timestamprows_read and rows_written in meta, so I could only validate this in production.Before:
After adding an index:
(so in addition to eliminating "writes", the index avoids reading the rows twice: from the original table, and then the temp table
 )
)