It fixed itself somehow, but I don't ask why as long as it works 🙂
It fixed itself somehow, but I don't ask why as long as it works 

 L
L BBL
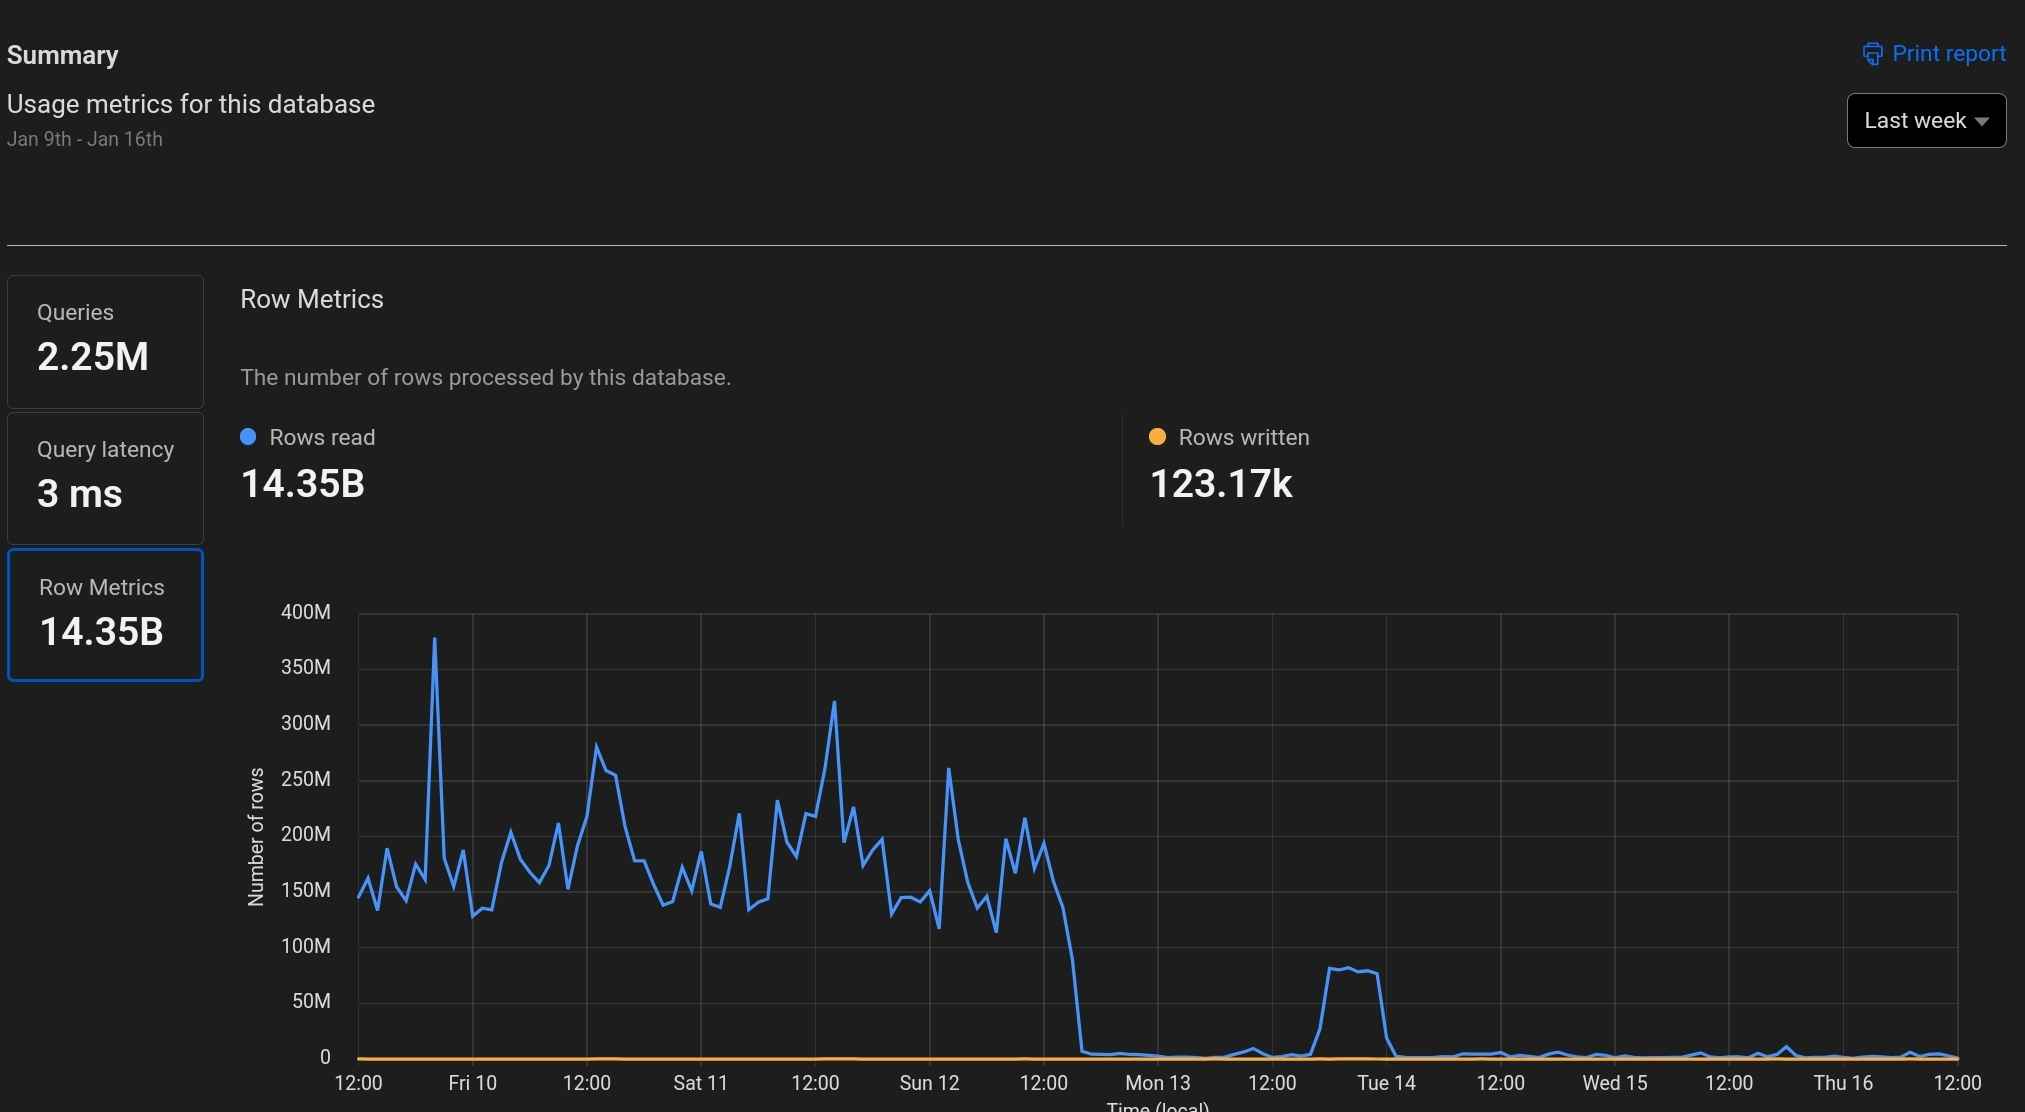
BBLCombined with db round trips (even with smart placement) being consistently high latency, has led us to have to move to Postgres. We notice that “cold start” times and round trips are consistently better from across the globe, even with a single Postgres instance in us-east :/
 M
Mwrangler d1 insights into the dash)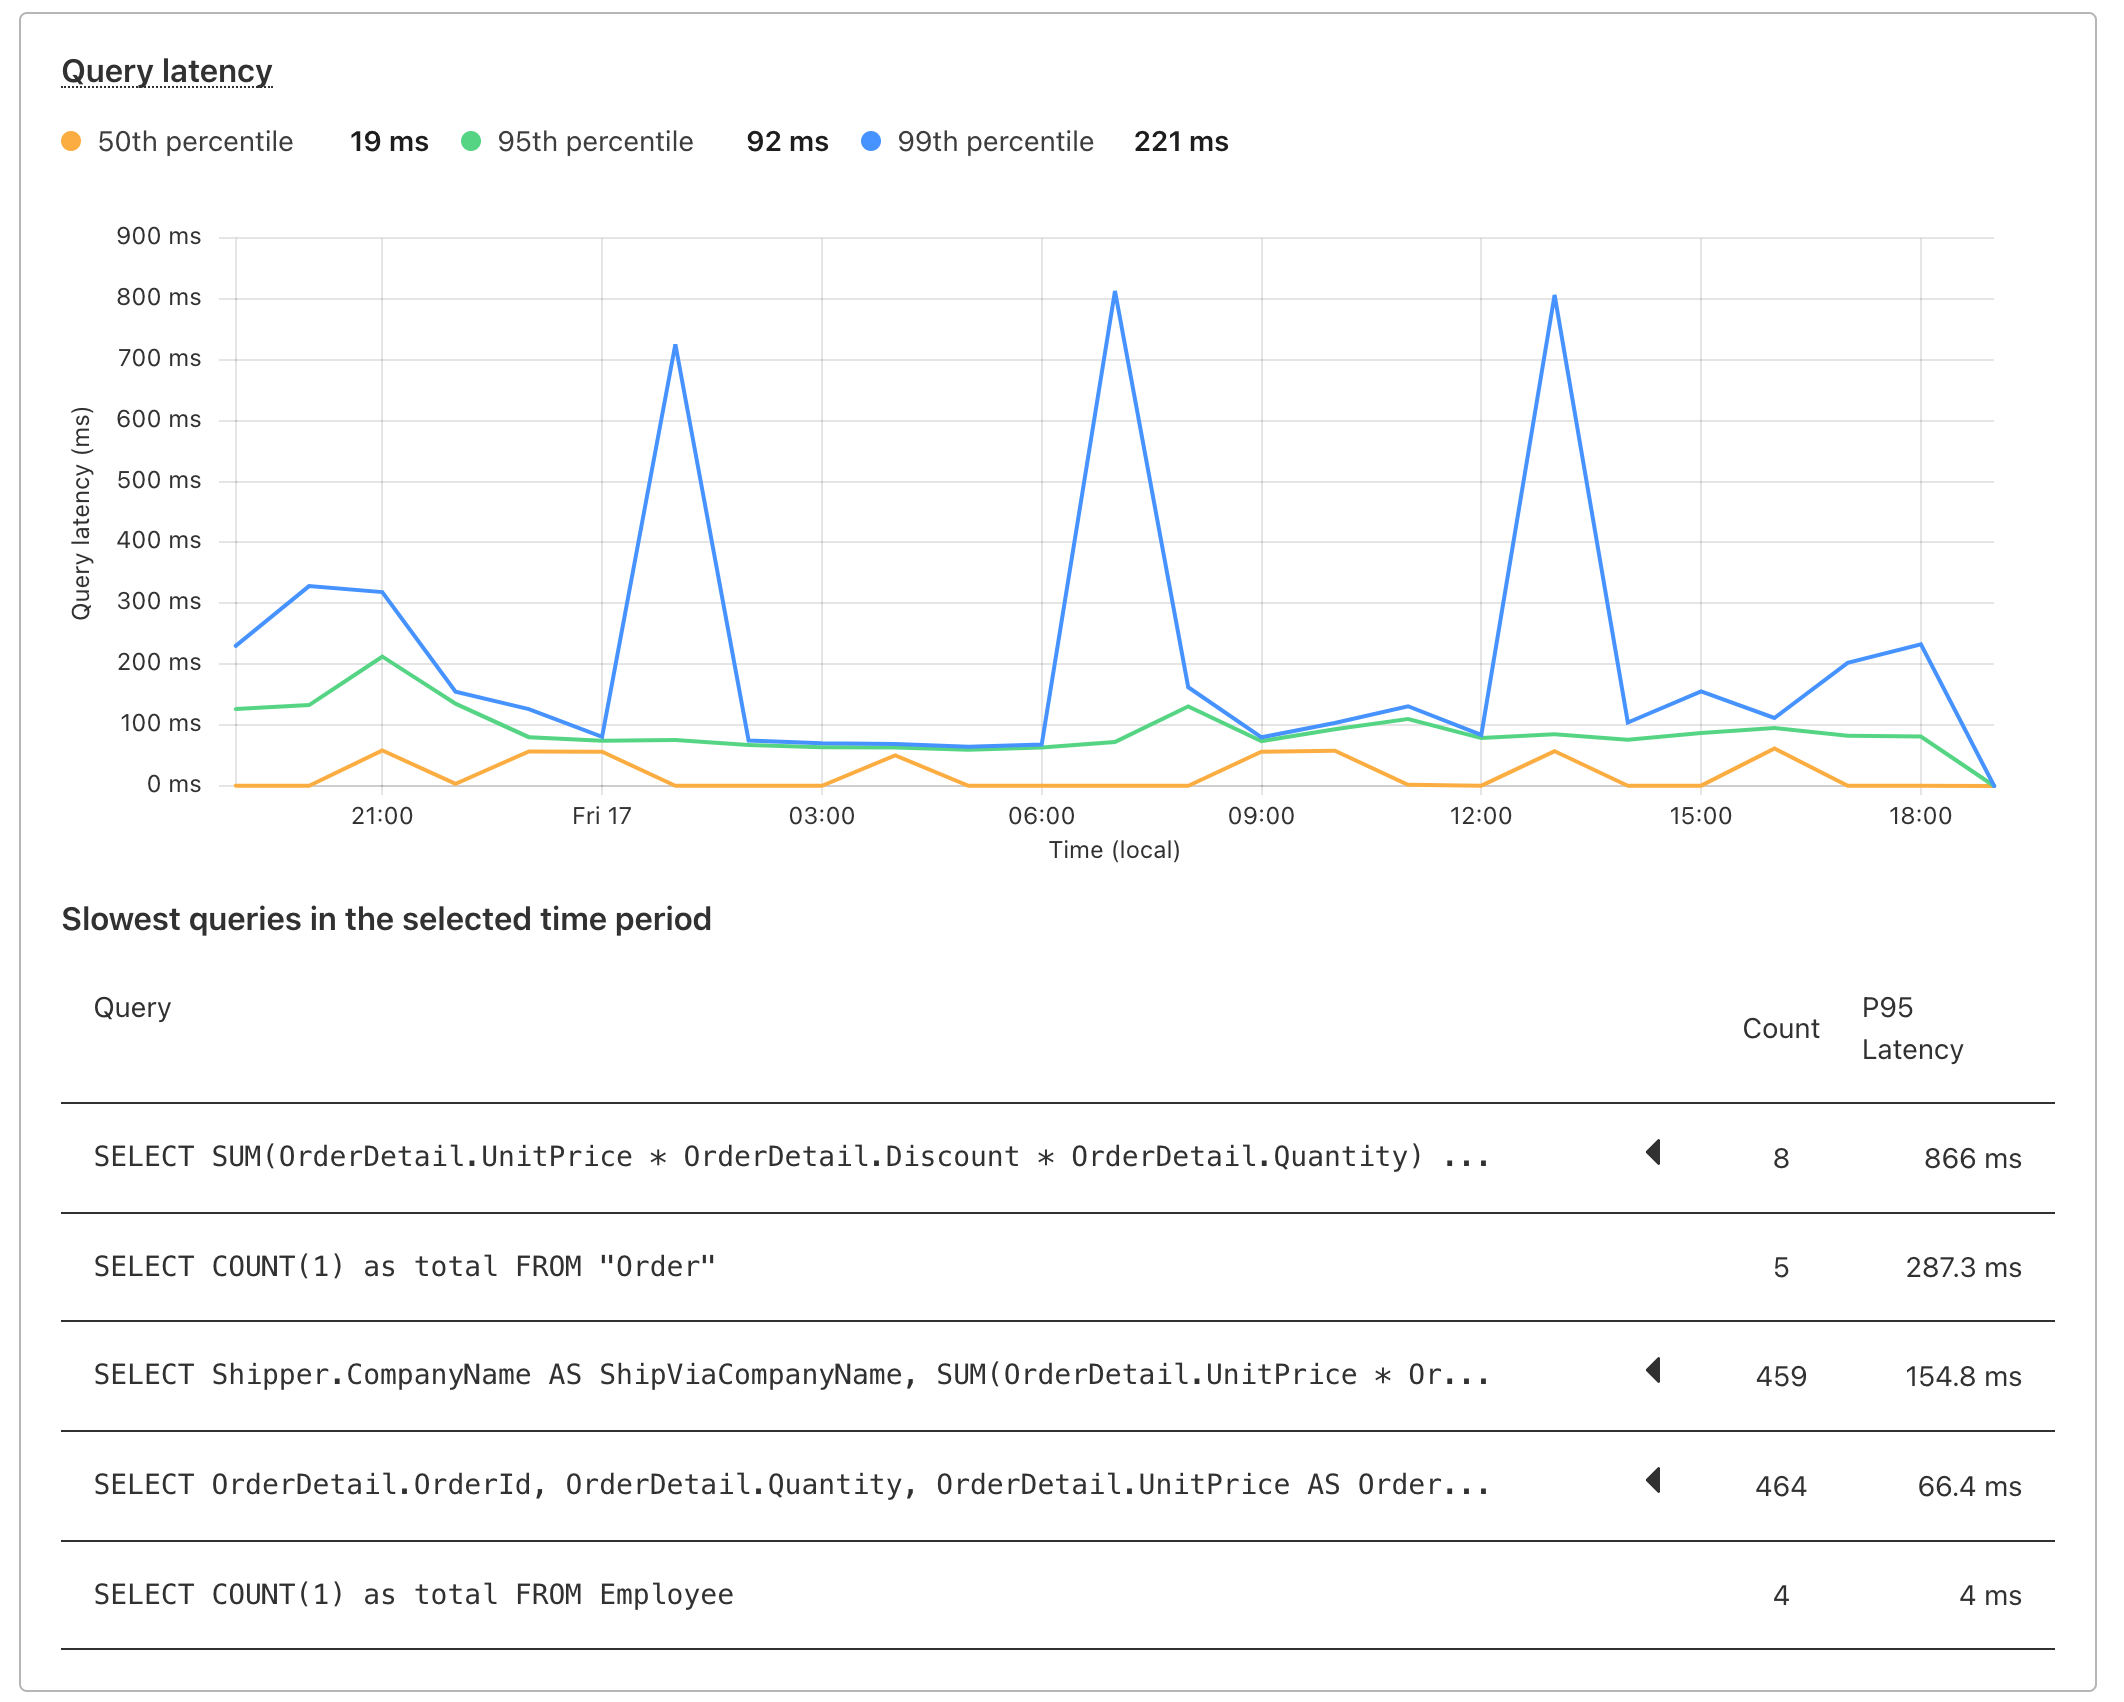 L
L SM
SM O
O DD
DD AO
AOSELECT * FROM objects WHERE userId = ?1 AND tag = ?2 ORDER BY created DESC LIMIT ?3 OFFSET ?4 userId and tagLIMIT was 100 I would expect 100 rows_read without the order, but with the order it shows every object in the tag x 2 (i.e. 600 rows_read for 300 existing objects with the tag).... Any way to optimize this? Or another way to order it in descending order without reading the entire index?M DL
DLFor example if my LIMIT was 100 I would expect 100 rows_read without the order,That's not correct. SQLite has to read rows of its indexes as well to figure out which rows you want. It's very rare that your
LIMIT will be the total number of rows the actual SQLite query will process. Keep in mind, indexes do count as rows read/written themselves too.EXPLAIN and see what SQLite tells you will do, you can do this in the D1 Console UI too. This is the most reliable way to see what index you are missing.MO O
O B
B MM
MM E
E 森L森LE森
 L
L L
LDoes a DO SQLite db not lock the entire database too though?
D AL
ALselect * from sqlite_master ?A_cf_KV and sqlite_sequence are also listedA EMEEEMEMEE
wrangler d1 insightsSELECT * FROM objects WHERE userId = ?1 AND tag = ?2 ORDER BY created DESC LIMIT ?3 OFFSET ?4userIdtagLIMITLIMITrows_readEXPLAINselect * from sqlite_master_cf_KVsqlite_sequence{
"query": "delete from \"magnetograms\" where (\"magnetograms\".\"timestamp\" < ? or \"magnetograms\".\"timestamp\" > ?)",
"avgRowsRead": 119275,
"totalRowsRead": 715650,
"avgRowsWritten": 119273,
"totalRowsWritten": 715638,
"avgDurationMs": 418.5989,
"totalDurationMs": 2511.5934,
"numberOfTimesRun": 6,
"queryEfficiency": 0
}