Infographics - argument maps
Fitting complex discussions and arguments into simple graphics is a great way to spread information and explain things.
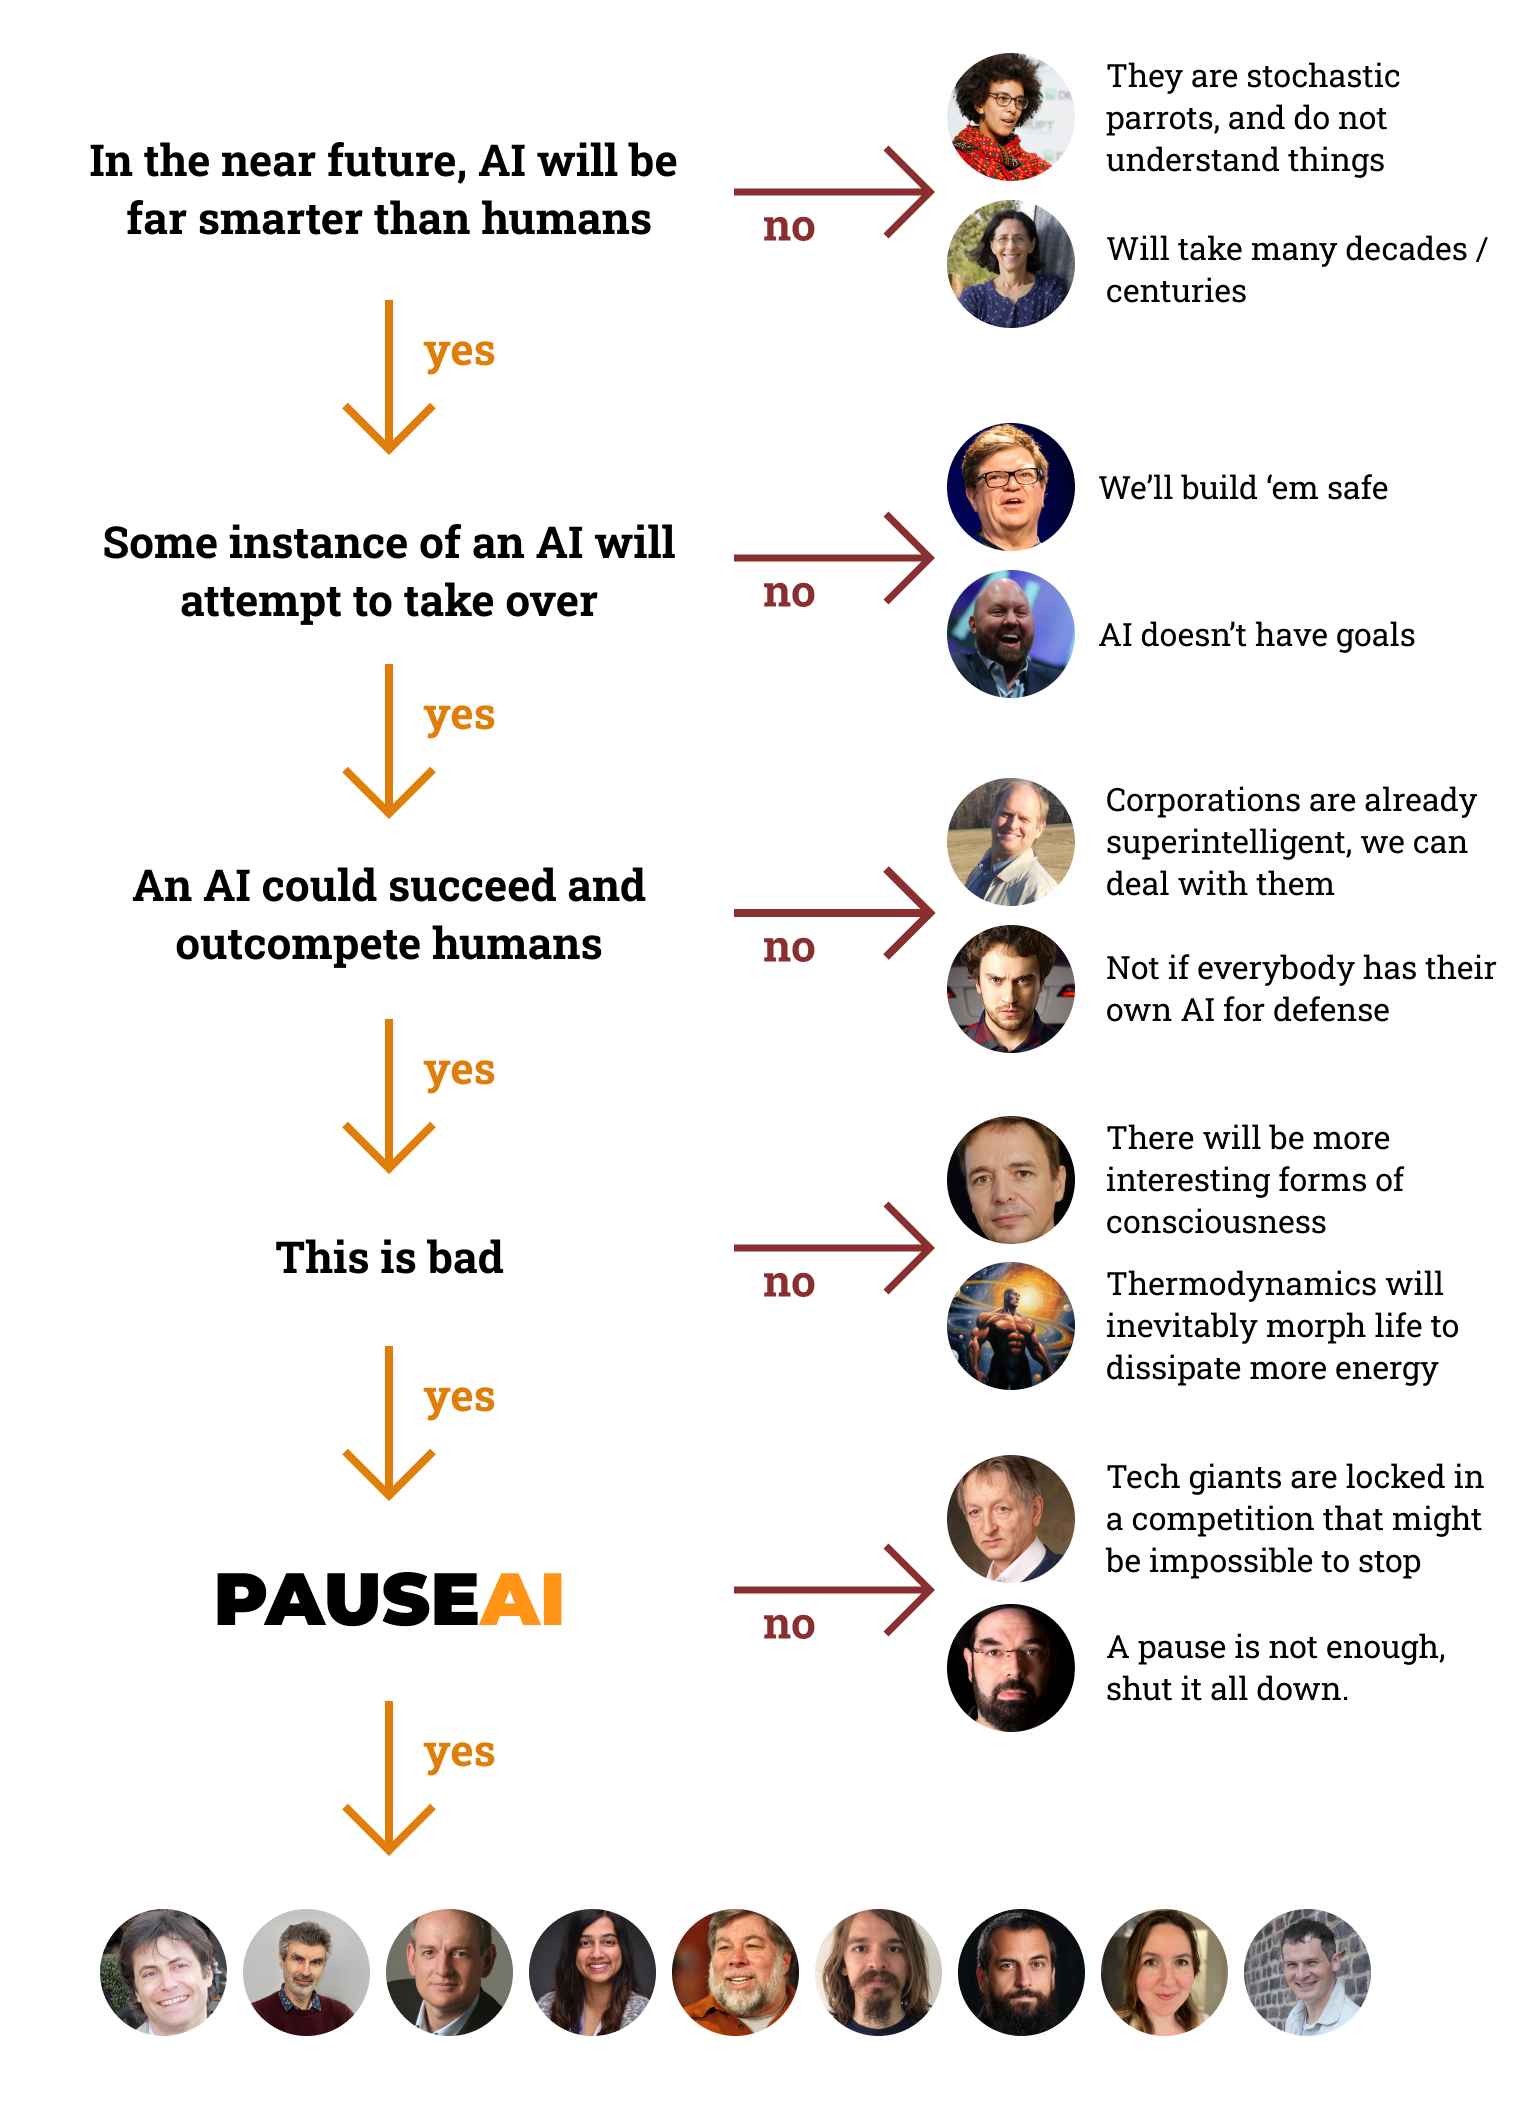
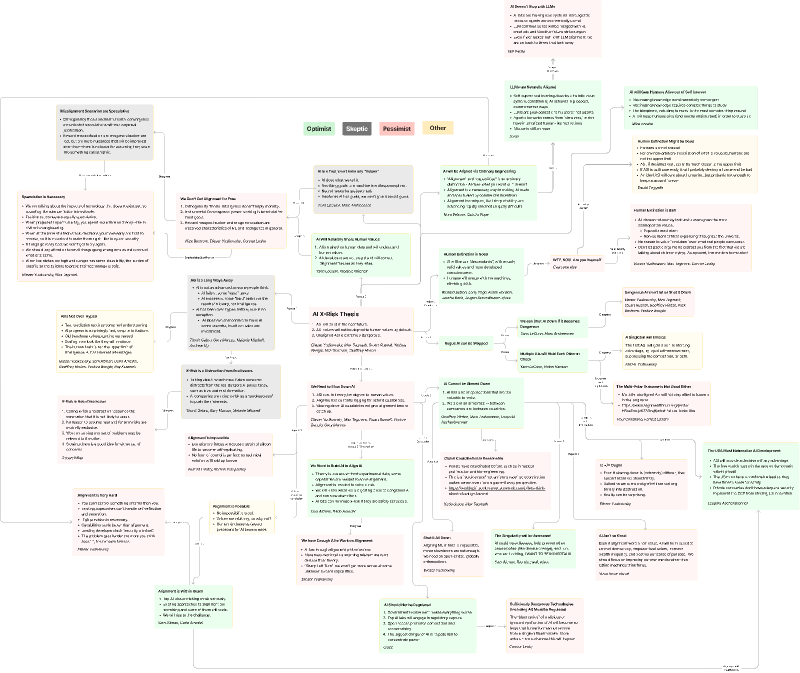
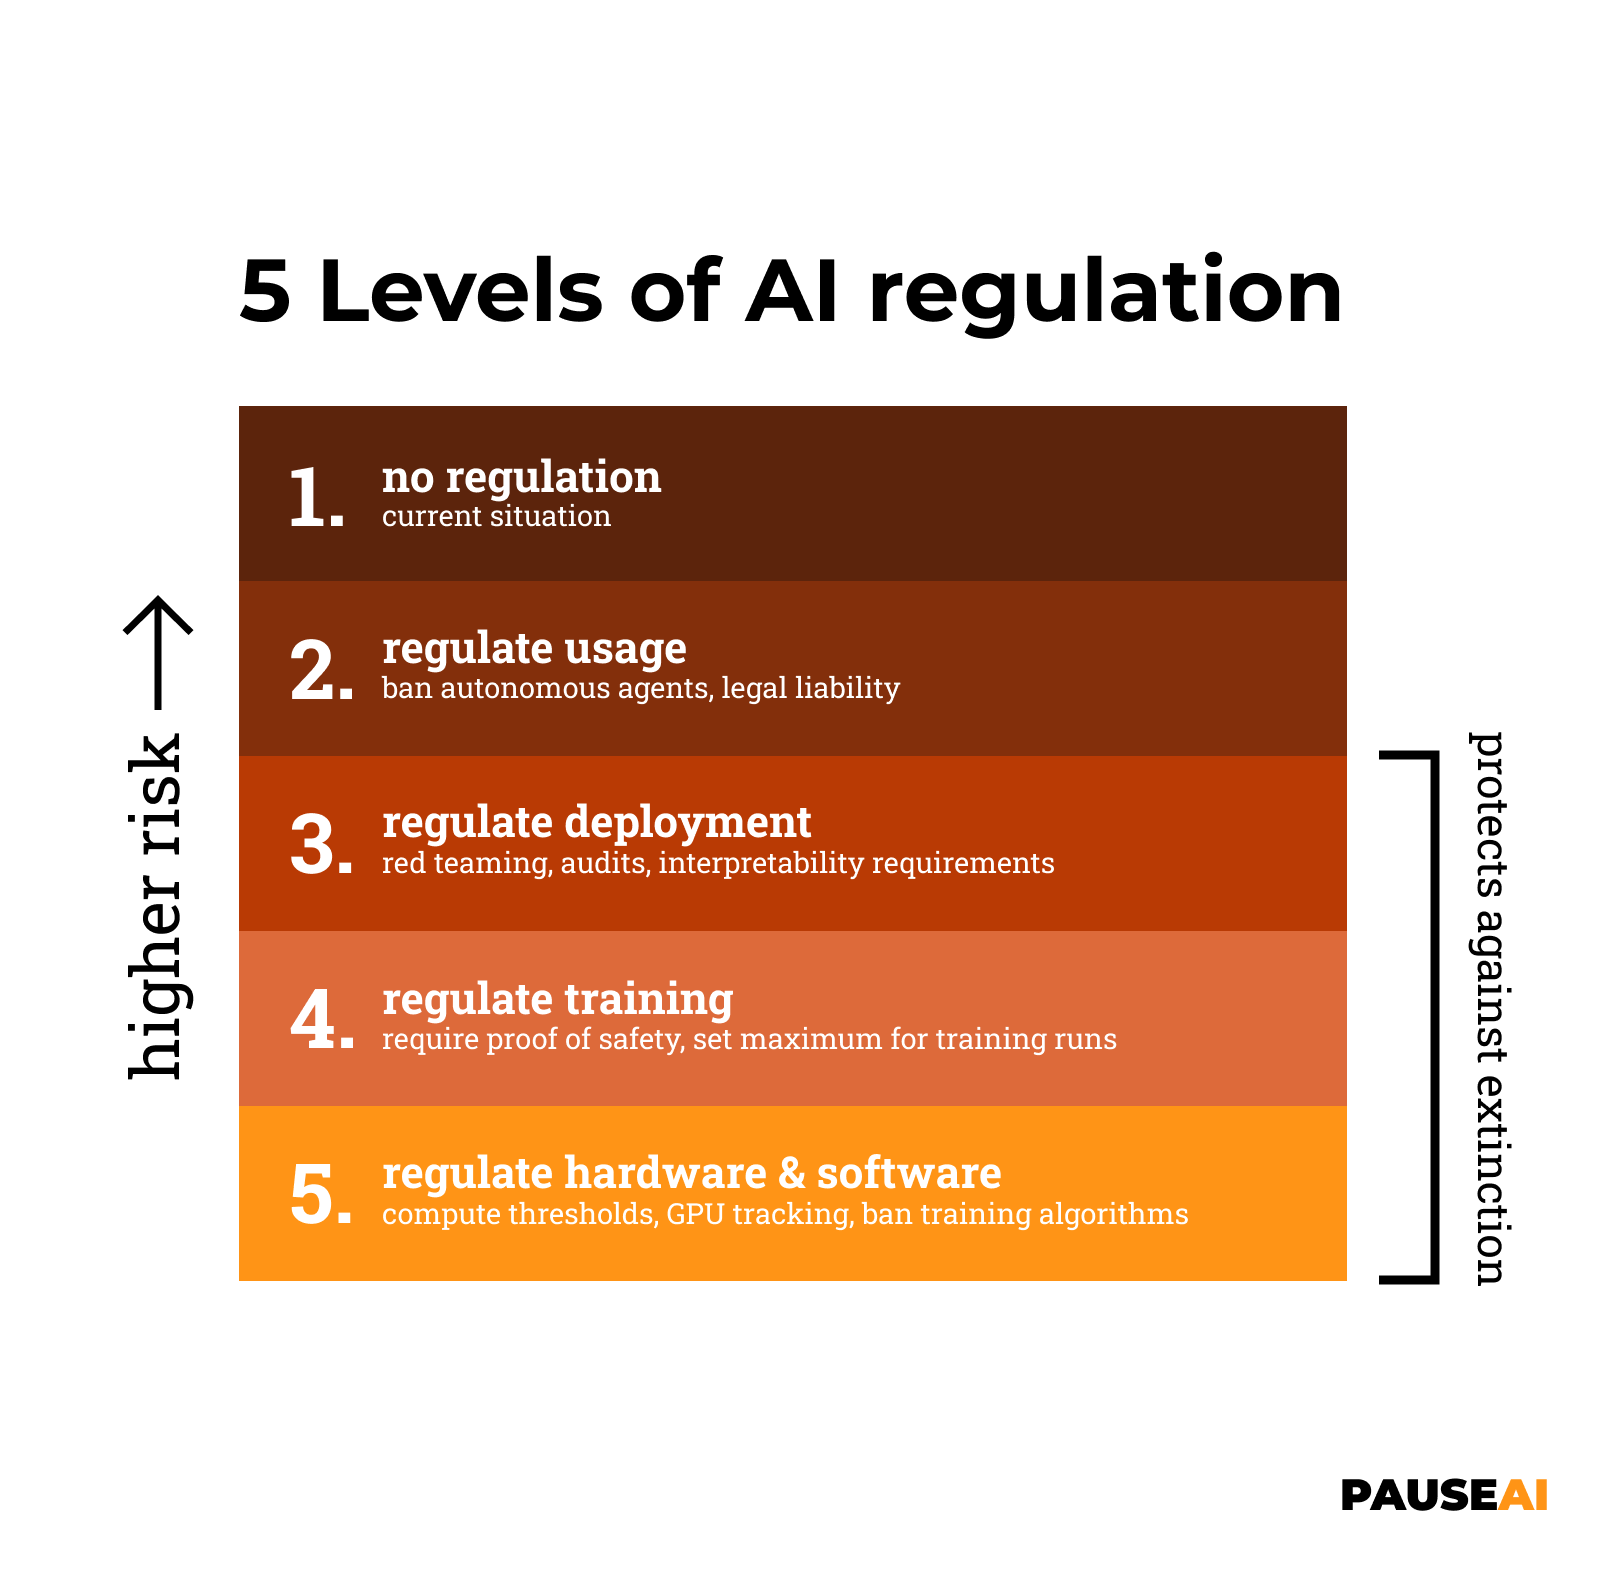
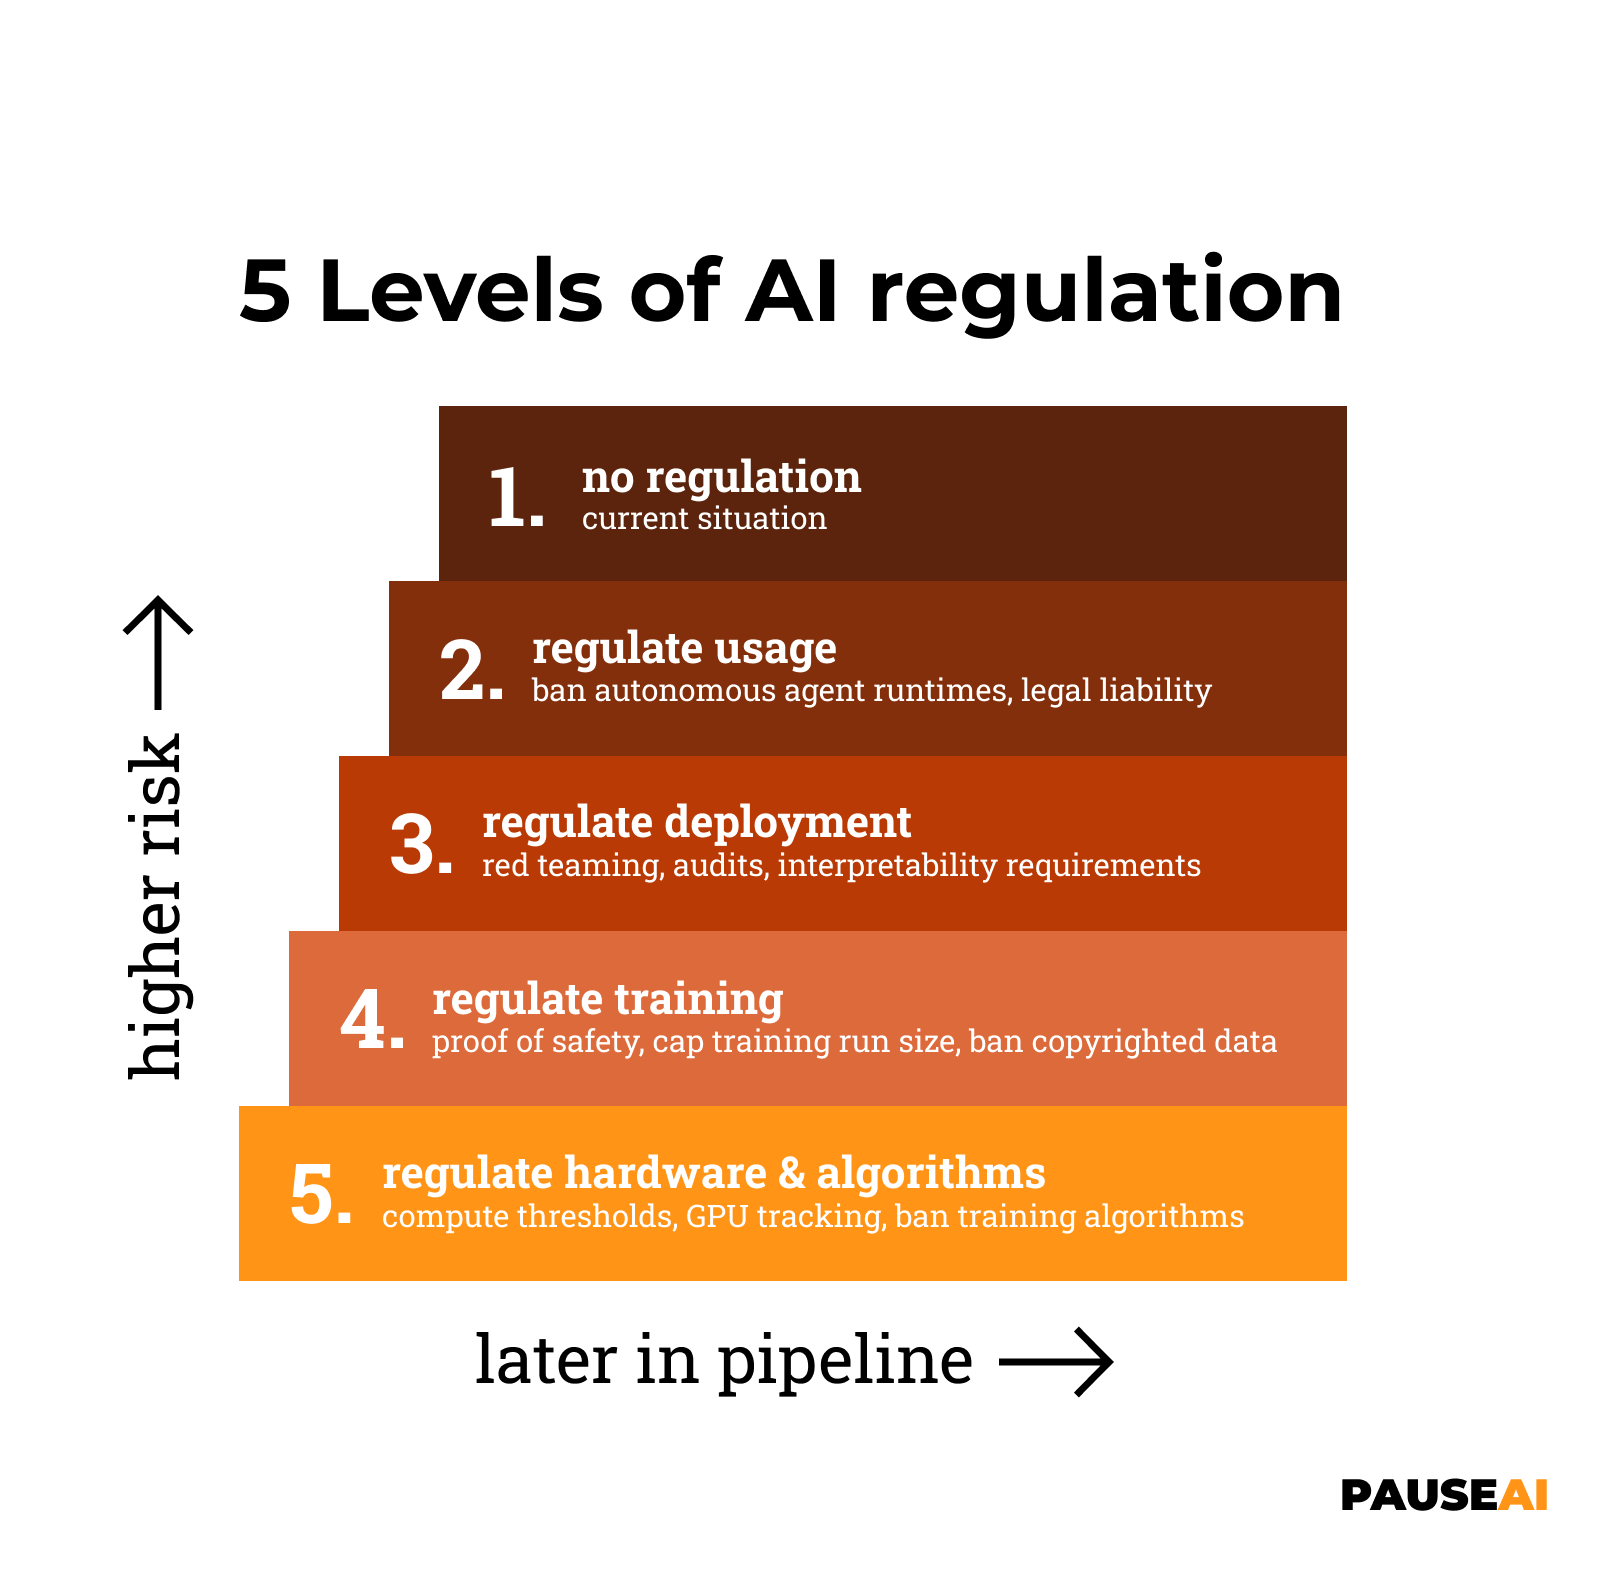
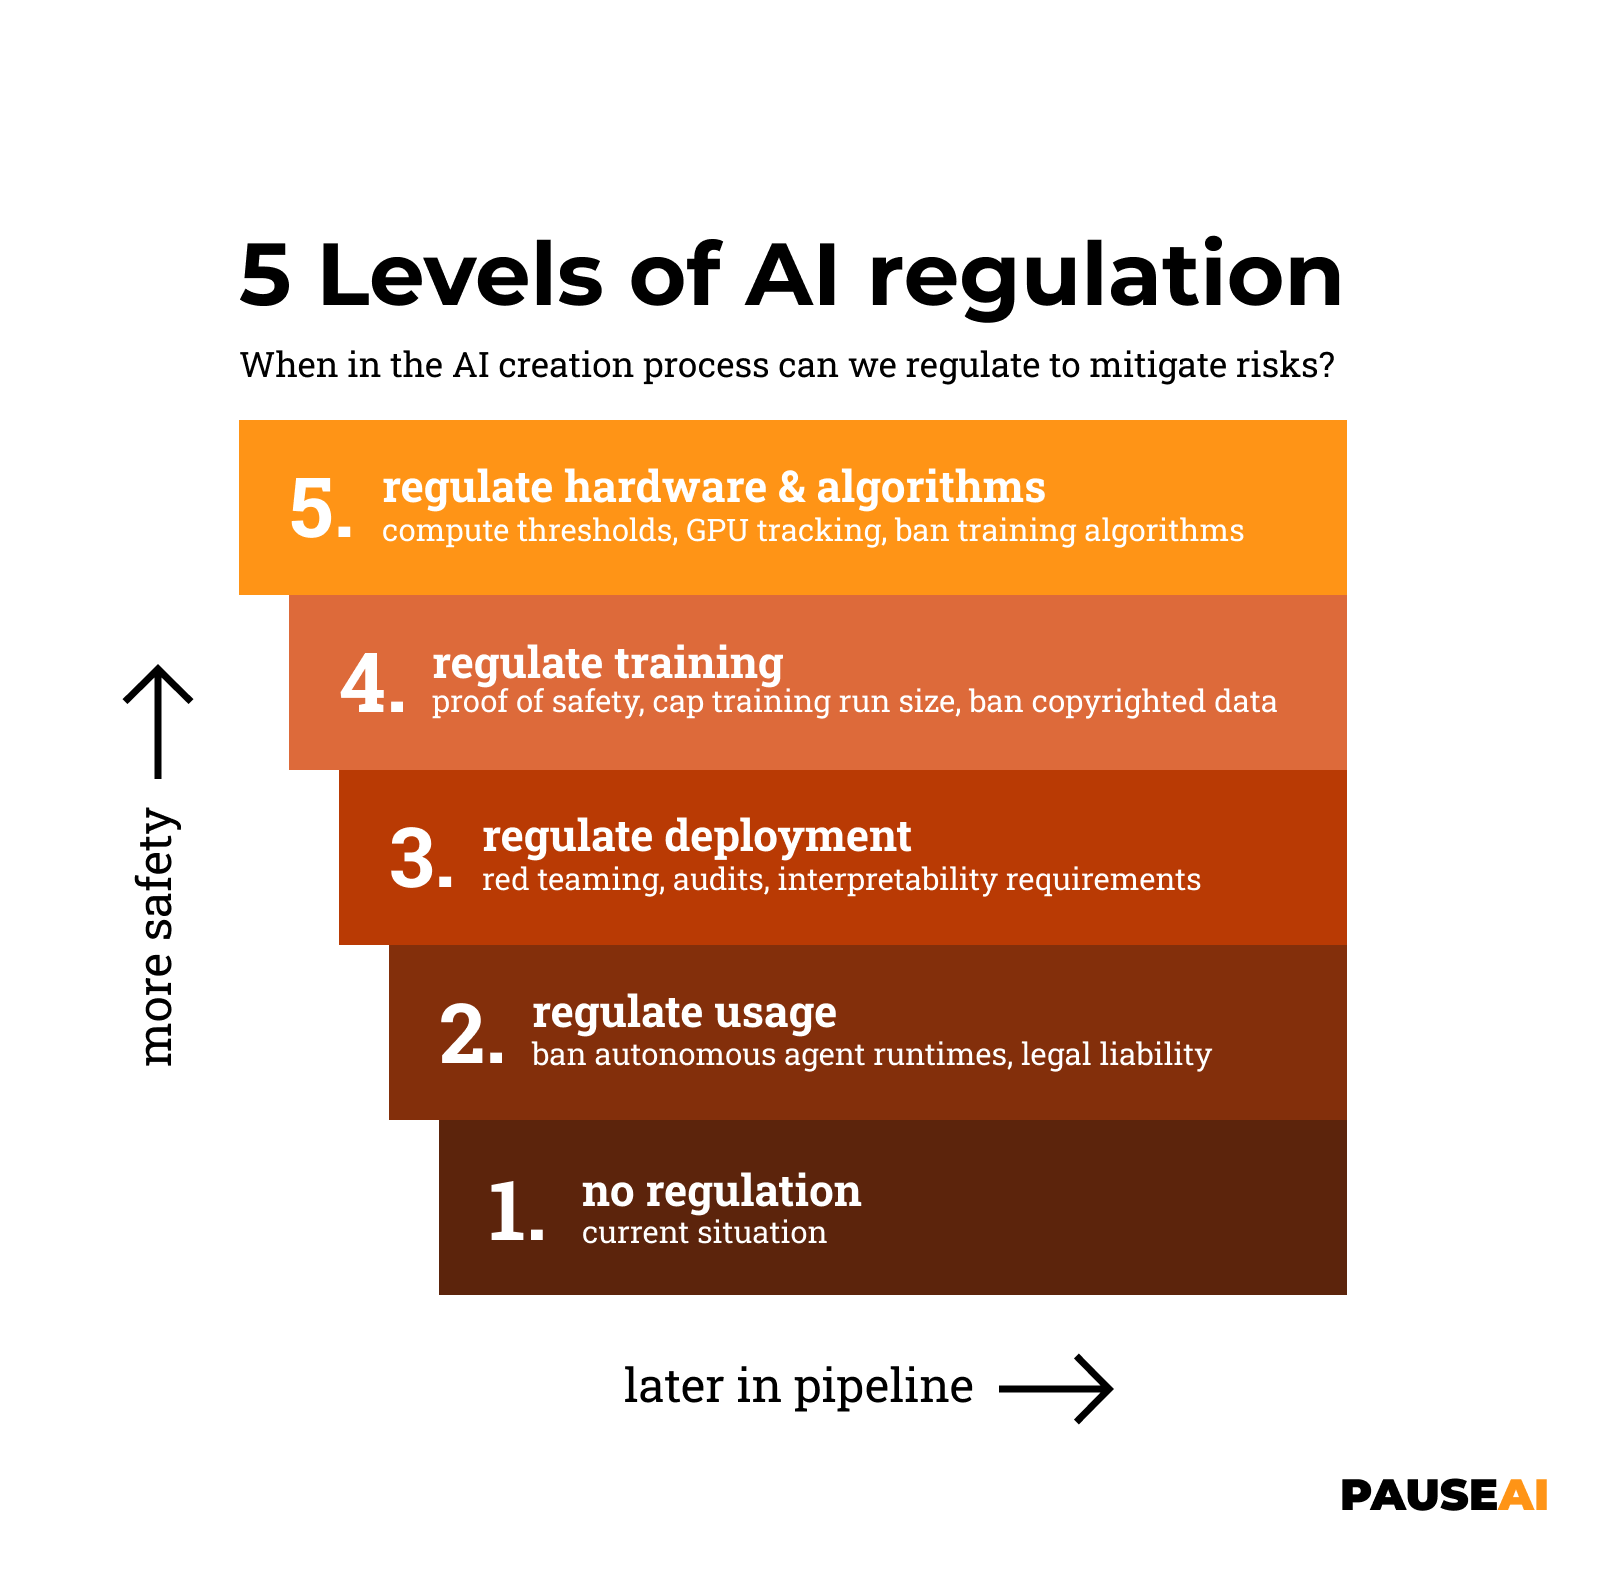
I'd like to work on these visualisations. I already made one flowchart / argument map to visualize some core disagreements in the AI debate.
- Share ideas for visualisations
- Give feedack on the ideas and execution
- Create or improve designs (they are accessible here: https://www.figma.com/community/file/1233064002969152026)
I'd like to work on these visualisations. I already made one flowchart / argument map to visualize some core disagreements in the AI debate.
How you can help
- Share ideas for visualisations
- Give feedack on the ideas and execution
- Create or improve designs (they are accessible here: https://www.figma.com/community/file/1233064002969152026)