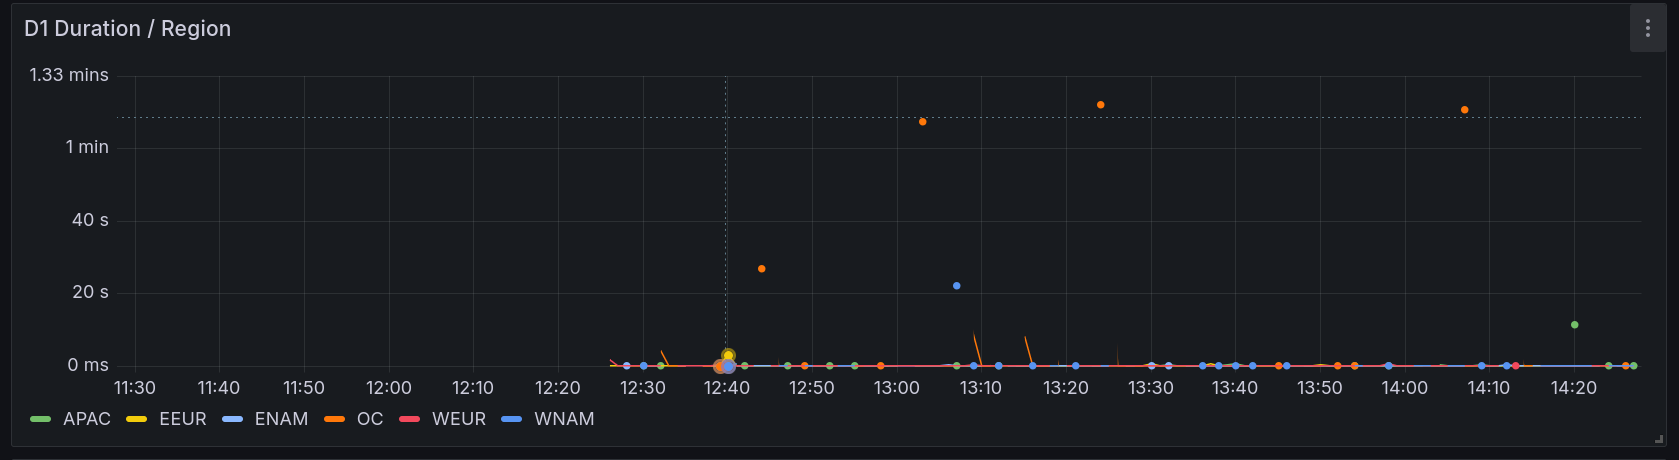
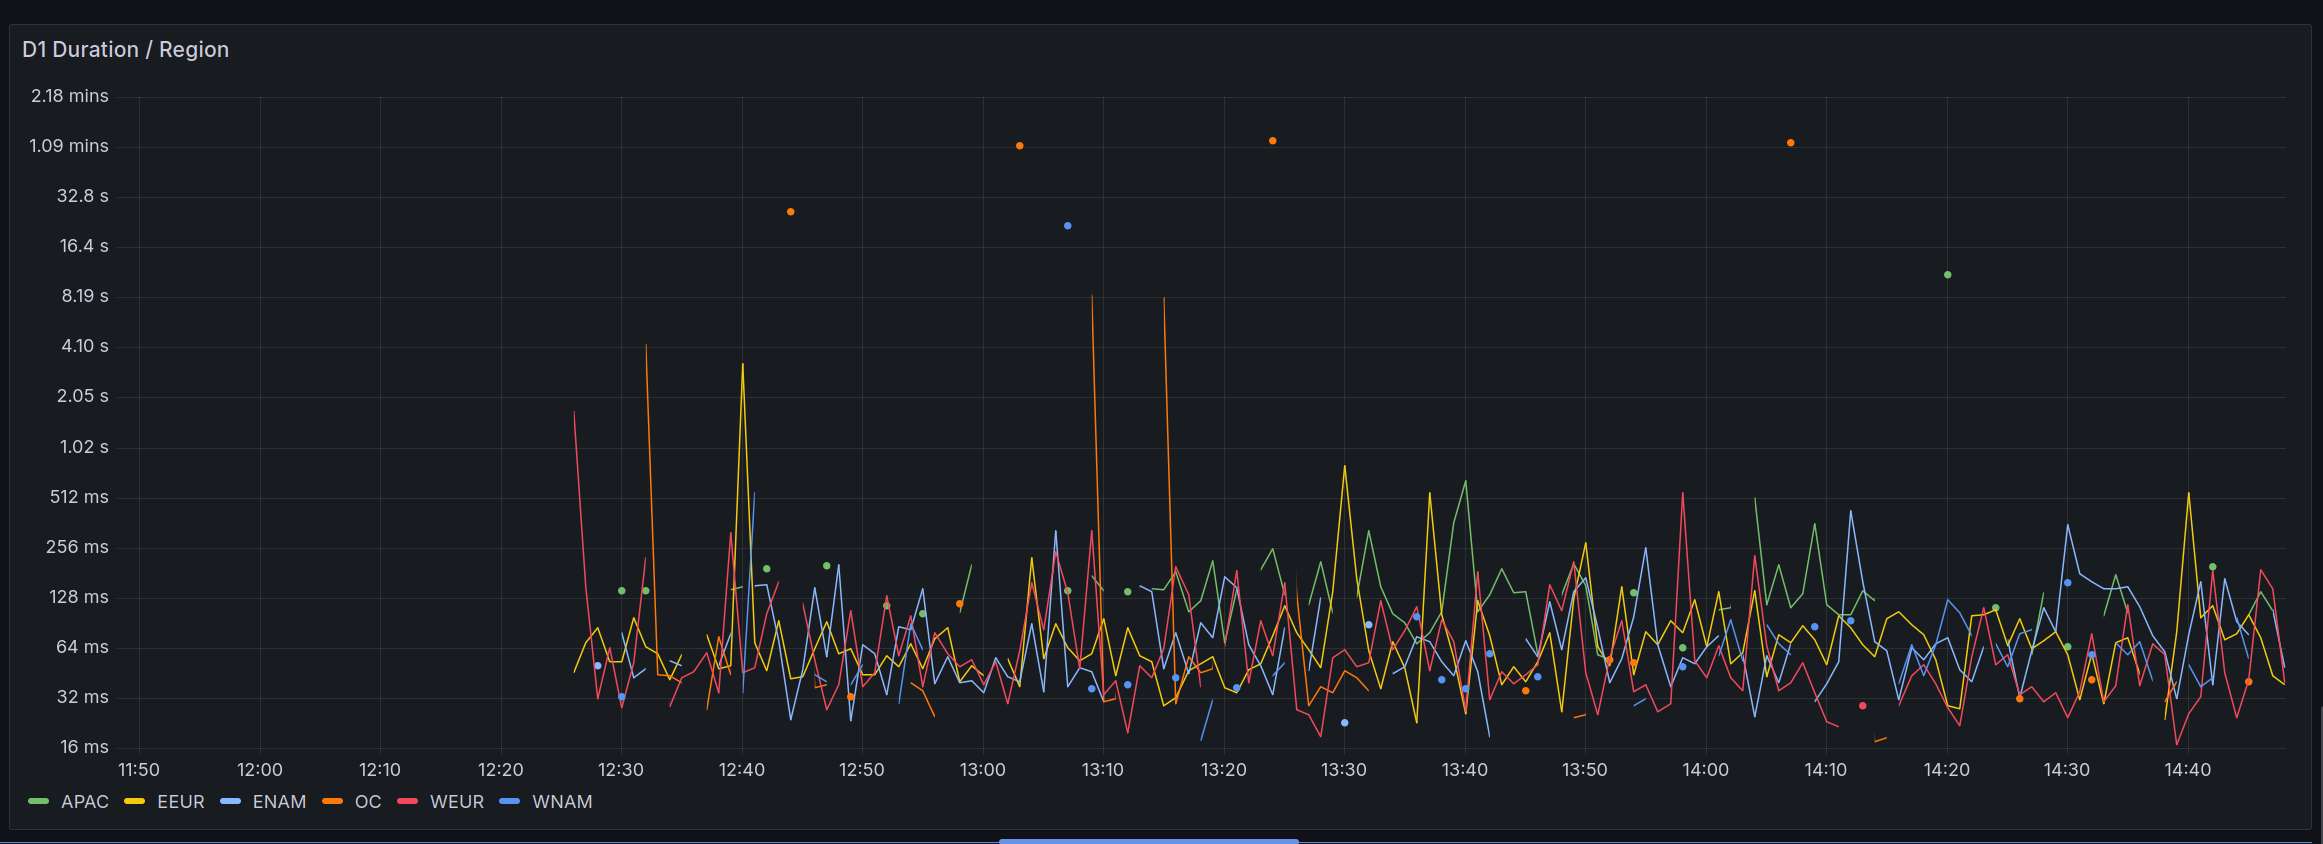
> but the difference between the before and after is accurate and does show a significant shift in o
but the difference between the before and after is accurate and does show a significant shift in our latenciesWhere is the difference in this graph? Can you post that instead of the percentiles that you say are wrong? What is the magnitude of the difference you see, 1s, 5s, 500ms?